How to Create Side by Side Boxplots in R
-
Use the
parFunction to Create Side by Side Boxplots in R -
Use the
grid.arrangeFunction to Create Side by Side Boxplots in R
This article will introduce methods of creating side-by-side boxplots in R.
Use the par Function to Create Side by Side Boxplots in R
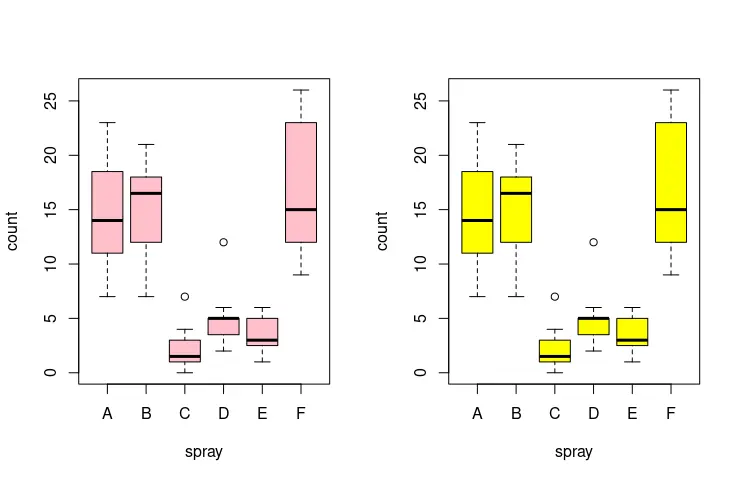
The par function can be used to set graphical parameters. Calling the function with no arguments or no.readonly = TRUE retrieves all graphical parameters. In this case, we utilize the mfrow parameter to construct side-by-side boxplots. mfrow is passed in the c(nr, nc) vector, and subsequent plots are drawn as nr-by-nc array. The following example code constructs two boxplots from the InsectSprays data-set, where count and spray columns are plotted accordingly. Even though an in-depth review of the boxplot function is beyond this article’s scope, it takes the col argument to specify the color of the box bodies. Notice that the last par(mfrow=c(1,1)) function call is used to reset the layout to the default setting.
par(mfrow=c(1,2))
boxplot(count ~ spray, data = InsectSprays, col = "pink")
boxplot(count ~ spray, data = InsectSprays, col = "yellow")
par(mfrow=c(1,1))
Use the grid.arrange Function to Create Side by Side Boxplots in R
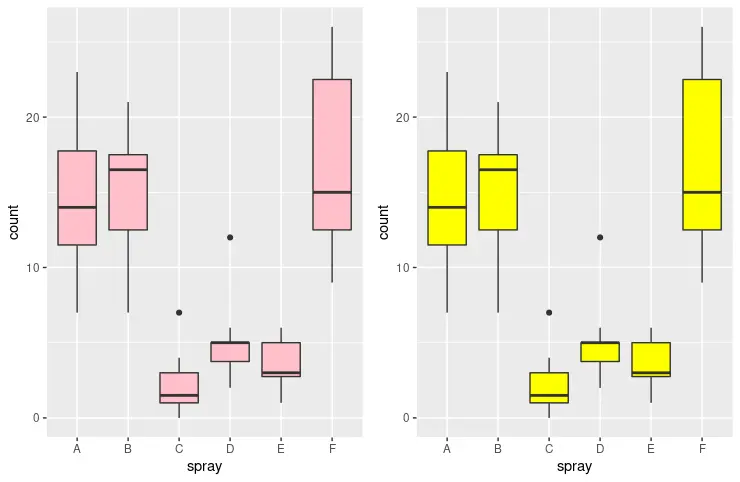
Alternatively, we can use grid.arrange function from gridExtra package. grid.arrange behaves similarly to the par function. Still, it is more flexible and intuitive with multiple plots, especially ggplot objects. grid.arrange takes a variable length of ggplot objects as the starting arguments. After, we can specify optional arguments, namely, the ncol parameter denoting the number of columns that need to be created for plots. The next code snippet draws two side-by-side boxplots.
library(ggplot2)
library(gridExtra)

plot1 <- ggplot(InsectSprays, aes(x = spray, y = count)) + geom_boxplot(fill = "pink")
plot2 <- ggplot(InsectSprays, aes(x = spray, y = count)) + geom_boxplot(fill = "yellow")
grid.arrange(plot1, plot2, ncol = 2)
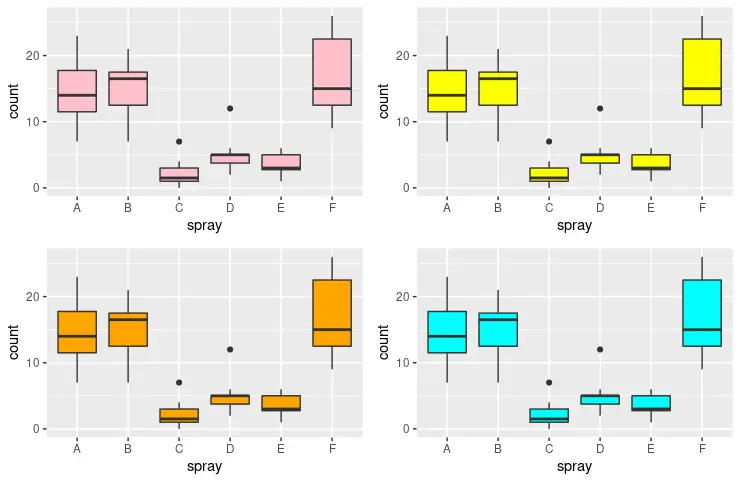
grid.arrange can also create two-dimensional split windows specified using both nrow and ncol parameters. Notice that ggplot objects can be combined into a list and passed in the form of the grobs = list(...) argument. The following example outputs four boxplots in a two-by-two matrix style.
library(ggplot2)
library(gridExtra)

plot1 <- ggplot(InsectSprays, aes(x = spray, y = count)) + geom_boxplot(fill = "pink")
plot2 <- ggplot(InsectSprays, aes(x = spray, y = count)) + geom_boxplot(fill = "yellow")
plot3 <- ggplot(InsectSprays, aes(x = spray, y = count)) + geom_boxplot(fill = "orange")
plot4 <- ggplot(InsectSprays, aes(x = spray, y = count)) + geom_boxplot(fill = "cyan")
grid.arrange(plot1, plot2, plot3, plot4, nrow = 2, ncol = 2)
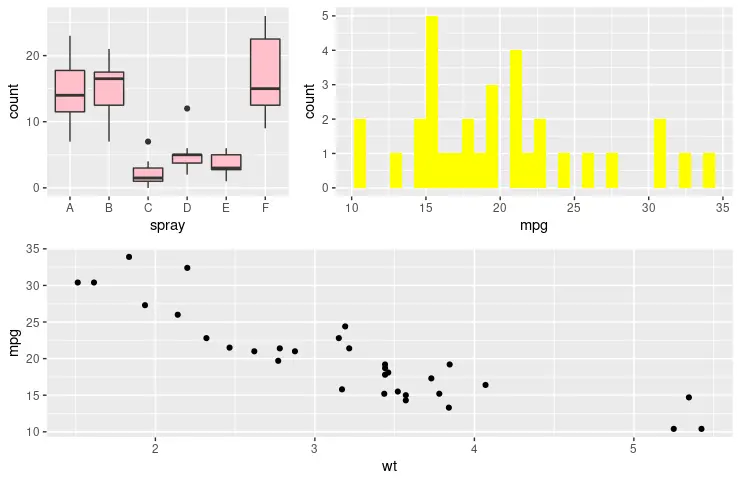
Another useful parameter for the grid.arrange function is layout_matrix, which positions each plot in a custom structure specified with combined vectors. The example defines three different plot objects constructed in an asymmetrical window structure - two plots on the top and one below. The number of vectors in rbind corresponds to the window rows, and elements in each object specify the number of parts the given window row should be split into. Meanwhile, the numbers correspond to the argument plots in the same order. If all split windows on the second row should be occupied by the third plot, then all elements in the second vector should have value - 3.
library(ggplot2)
library(gridExtra)

plot1 <- ggplot(InsectSprays, aes(x = spray, y = count)) + geom_boxplot(fill = "pink")
plot2 <- ggplot(mtcars, aes(x = mpg)) + geom_histogram(fill = "yellow", bins = 30)
plot3 <- ggplot(mtcars, aes(x = wt, y = mpg)) + geom_point(fill = "orange")

grid.arrange(plot1, plot2, plot3, widths = c(2, 2, 1),
    layout_matrix = rbind(c(1, 2, 2), c(3, 3, 3)))

Founder of DelftStack.com. Jinku has worked in the robotics and automotive industries for over 8 years. He sharpened his coding skills when he needed to do the automatic testing, data collection from remote servers and report creation from the endurance test. He is from an electrical/electronics engineering background but has expanded his interest to embedded electronics, embedded programming and front-/back-end programming.
LinkedIn Facebook