How to Plot an Equation in MATLAB

Plotting equations in MATLAB is a fundamental skill that can enhance your data visualization capabilities. Whether you’re a student, researcher, or professional engineer, the ability to visualize mathematical equations can help you better understand complex concepts. MATLAB provides several functions to plot equations, with the plot() and ezplot() functions being two of the most commonly used.
In this article, we will explore how to effectively use these functions to create informative and visually appealing plots. By the end, you’ll be equipped with the knowledge to plot various equations in MATLAB, enhancing your analytical skills and improving your project presentations.
Using the plot() Function
The plot() function is one of the most versatile and widely used functions in MATLAB for creating 2D plots. It allows you to create a plot by specifying the x and y data points directly. This is particularly useful when you have discrete data points or when you want to plot a function that you can define explicitly.
Here’s a simple example of how to use the plot() function to visualize the equation y = x^2:
a = -5:0.01:5;
b = cos(a).^2+cos(a).^3;
plot(a,b)
Output:
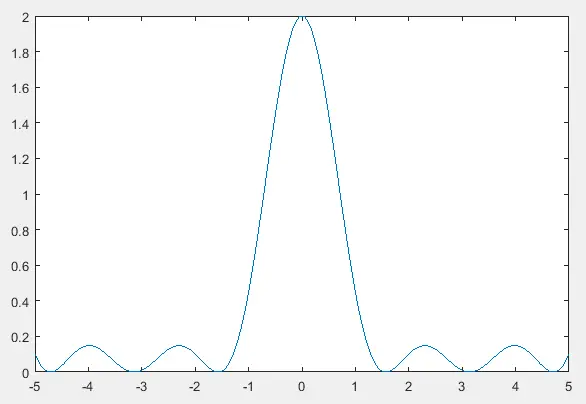
In the above code, we declared a random value of the independent variable to calculate the values of the dependent variable, you can change the values of the independent variable according to your requirements. You can also increase the number of independent variable according to you equation.
The plot() function is excellent for visualizing equations where you can explicitly define the relationship between x and y. It gives you complete control over the appearance of the plot, including line styles, colors, and markers. You can also overlay multiple plots on the same axes, which is particularly useful for comparing different equations or datasets.
Using the ezplot() Function
If you want a quicker way to plot equations without explicitly defining the data points, the ezplot() function is your go-to tool. This function is designed to plot symbolic expressions and functions directly. It’s particularly useful for plotting more complex equations or when you want to visualize a function defined symbolically.
Here’s a simple example using ezplot() to plot the equation y = sin(x):
f = @(a) cos(a).^2+cos(a).^3;
ezplot(f)
Output:
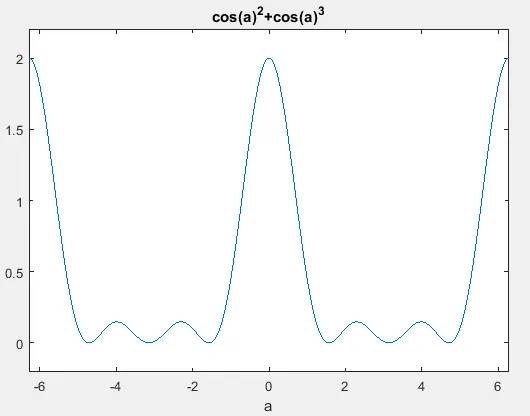
In the above code, we declared the equation as a function f, and as you can see the output is the same as the above output with only deference in independent variable values. The ezplot() function automatically assigns values to the independent variables. You can also increase the number of independent variable according to you equation.
The ezplot() function is particularly advantageous when dealing with complex equations that may not be easily expressed with discrete data points. It automatically handles the computation of values, allowing for a more straightforward approach to plotting. This makes it an excellent choice for students and professionals who need to visualize mathematical functions quickly.
Conclusion
In conclusion, MATLAB offers powerful tools for plotting equations, with the plot() and ezplot() functions being two of the most effective. The plot() function gives you fine control over your plots by allowing you to specify x and y values directly, making it ideal for discrete datasets. On the other hand, ezplot() simplifies the process of visualizing symbolic equations, enabling you to plot complex functions with minimal effort. By mastering these functions, you can enhance your data visualization skills in MATLAB, making your analyses more insightful and impactful.
FAQ
-
What is the difference between plot() and ezplot() in MATLAB?
plot() requires explicit x and y data points, while ezplot() allows you to plot symbolic expressions directly. -
Can I customize the appearance of my plots in MATLAB?
Yes, MATLAB provides various options to customize line styles, colors, markers, titles, and labels. -
Is it possible to plot multiple equations on the same graph?
Absolutely! You can use the hold on command to overlay multiple plots in the same figure. -
What types of equations can I plot using MATLAB?
You can plot linear, polynomial, trigonometric, and even more complex equations using both plot() and ezplot(). -
How can I save my plots in MATLAB?
You can save your plots using thesaveas()function or theexportgraphics()function for more advanced options.
