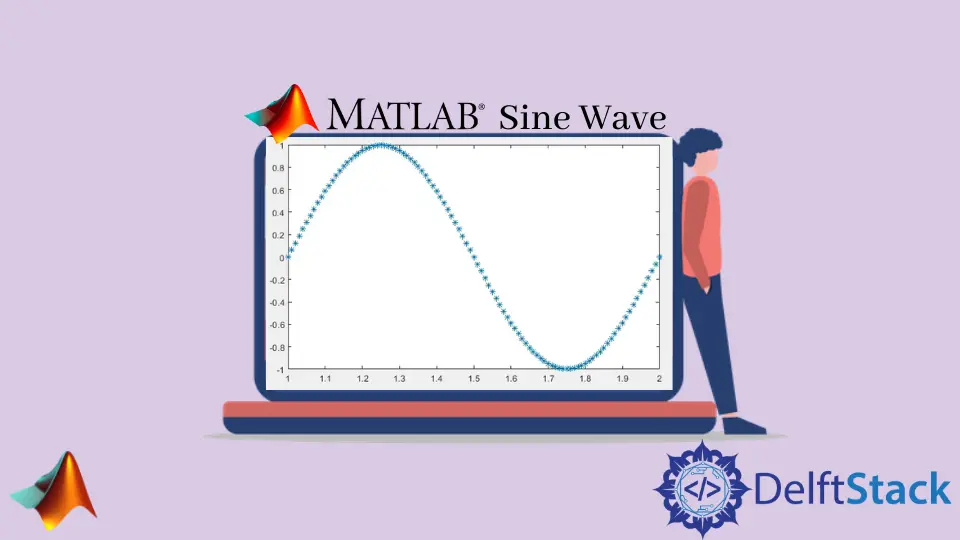
How to Plot Sine Wave in Matlab
- Setting Up MATLAB for Plotting
- Customizing Your Sine Wave Plot
- Adding Multiple Sine Waves
- Conclusion
- FAQ
Creating visual representations of mathematical functions can be a rewarding experience, especially when it comes to plotting sine waves in MATLAB. Whether you’re a student, engineer, or hobbyist, understanding how to plot a sine wave can enhance your data visualization skills and help you convey complex concepts more effectively.
In this article, we will explore the straightforward method of using the plot() function in MATLAB to graph a sine wave. By the end, you will have a solid grasp of how to create and customize sine wave plots, making your MATLAB experience even more enjoyable and productive.
Setting Up MATLAB for Plotting
To get started, you need to have MATLAB installed on your computer. Once you have it up and running, you can begin plotting your sine wave. The process is quite simple and involves generating the data points for the sine wave and then using the plot() function to visualize it. Here’s how to do it step by step.
Generating Sine Wave Data
To plot a sine wave, you first need to generate the x-values and the corresponding y-values. The x-values typically represent time or angle, while the y-values are the sine of those angles. Here’s a sample code snippet to help you get started:
x = 0:0.01:2*pi;
y = sin(x);
plot(x, y);
title('Sine Wave');
xlabel('x (radians)');
ylabel('sin(x)');
grid on;
The code above generates x-values ranging from 0 to 2π in increments of 0.01. It then calculates the sine of each x-value and stores the results in the variable y. The plot() function is then used to create the sine wave graph, complete with titles and labels for clarity.
Output:
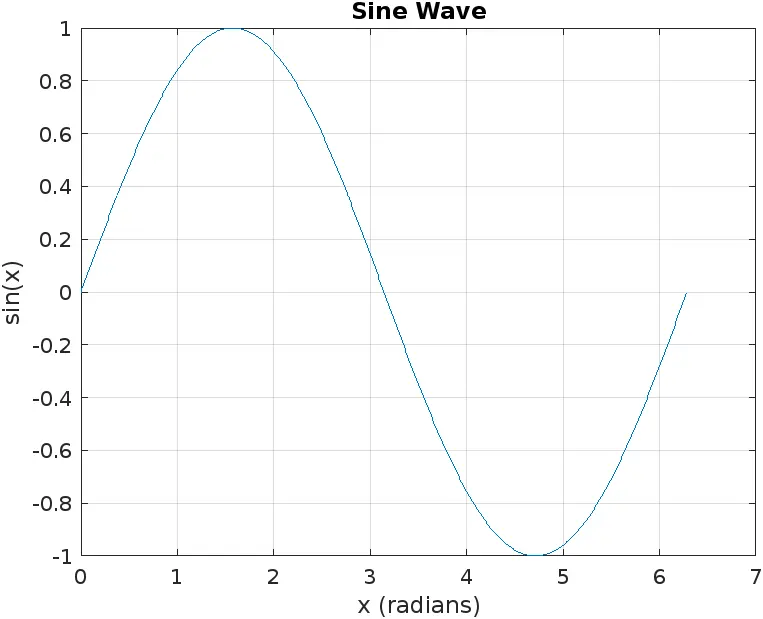
The grid on command adds a grid to the plot, making it easier to read. You can customize the appearance further by changing colors or line styles in the plot() function.
Customizing Your Sine Wave Plot
MATLAB offers a wide range of customization options to make your sine wave plot more visually appealing or informative. You can change the line color, style, and marker type to distinguish between multiple plots or to highlight specific features of your sine wave.
Example of Customization
Here’s an example that adds some flair to your sine wave plot:
x = 0:0.01:2*pi;
y = sin(x);
plot(x, y, 'r--', 'LineWidth', 2);
title('Customized Sine Wave');
xlabel('x (radians)');
ylabel('sin(x)');
grid on;
In this code, the sine wave is plotted with a red dashed line ('r--') and a line width of 2. You can experiment with different colors and line styles by changing the parameters in the plot() function.
Output:
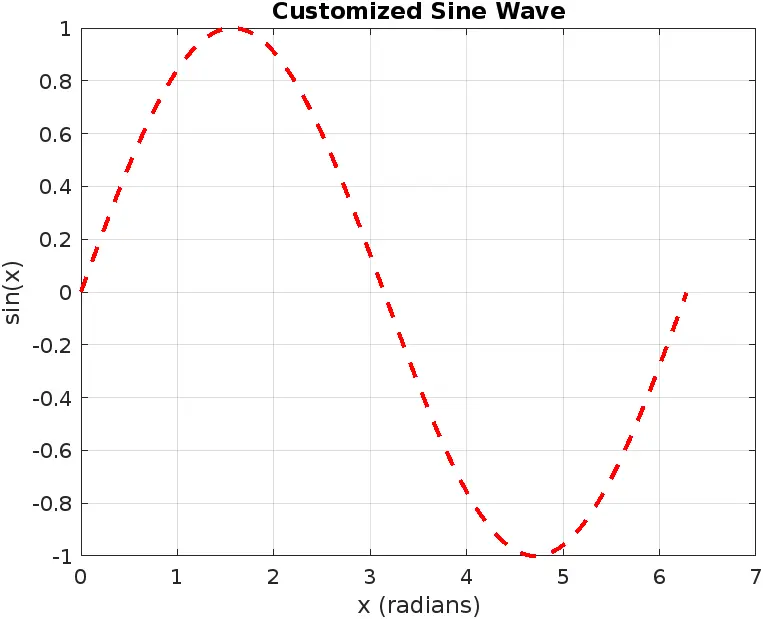
Customization can help in presentations or reports where you want to emphasize certain aspects of the data. By adjusting the aesthetics, you can make your sine wave plot not only functional but also visually appealing.
Adding Multiple Sine Waves
One of the powerful features of MATLAB is the ability to overlay multiple plots. You can plot multiple sine waves with different frequencies or amplitudes on the same graph for comparative analysis.
Plotting Multiple Waves
Here’s how you can plot two sine waves with different frequencies:
x = 0:0.01:2*pi;
y1 = sin(x);
y2 = 0.5*sin(2*x);
plot(x, y1, 'b', x, y2, 'g--');
title('Multiple Sine Waves');
xlabel('x (radians)');
ylabel('Amplitude');
legend('sin(x)', '0.5*sin(2x)');
grid on;
In this example, we plot two sine waves: the first one is the standard sine wave, while the second has double the frequency and half the amplitude. The legend() function is used to label each sine wave, making it easy for viewers to differentiate between them.
Output:
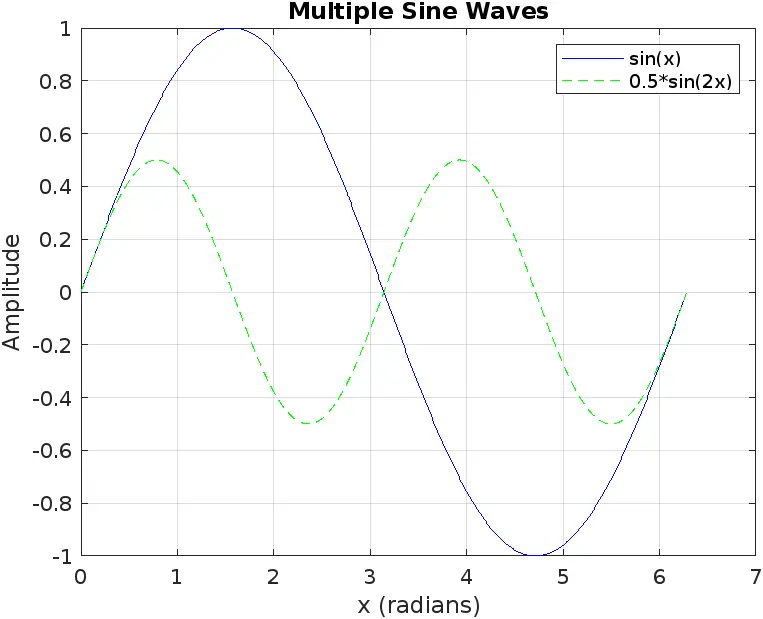
By overlaying multiple sine waves, you can visualize how changes in frequency and amplitude affect the overall shape of the wave. This is particularly useful in engineering and physics applications where such comparisons are common.
Conclusion
Plotting a sine wave in MATLAB is a straightforward yet powerful skill that can enhance your data visualization capabilities. By utilizing the plot() function, you can create clear, informative graphs that illustrate the properties of sine waves. Whether you choose to customize your plots or overlay multiple sine waves, MATLAB provides the tools you need to create professional-quality visualizations. As you continue to explore MATLAB, you’ll discover even more ways to leverage its powerful plotting functions to represent data effectively.
FAQ
-
How do I install MATLAB?
You can download MATLAB from the MathWorks website, where you can choose a version suitable for your operating system. -
Can I plot other functions besides sine waves in MATLAB?
Yes, MATLAB allows you to plot a variety of mathematical functions, including cosine, tangent, and more. -
What is the purpose of the grid in a MATLAB plot?
The grid helps improve readability by providing reference lines, making it easier to interpret the data. -
Can I save my MATLAB plots as images?
Absolutely! You can use thesaveas()function to save your plots in various formats like PNG, JPEG, or PDF. -
Is MATLAB suitable for real-time data plotting?
Yes, MATLAB can handle real-time data plotting, making it an excellent choice for applications that require live data visualization.
