How to Hide Axis in MATLAB

When working with MATLAB, you may find yourself in situations where you want to create visually appealing plots without the distraction of axis ticks and labels. Hiding these elements can help draw attention to the data itself, making your visualizations cleaner and more professional.
In this article, we will explore two primary methods for hiding axes in MATLAB: using the axis off command and the set() function. Whether you’re preparing graphics for a presentation or simply want to enhance the aesthetics of your plots, mastering these techniques will elevate your MATLAB skills. Let’s dive into the details!
Method 1: Using the axis off Command
The axis off command is one of the simplest ways to hide the axes in MATLAB. This command effectively removes all axis ticks, labels, and the box surrounding the plot. It’s perfect for situations where you want to focus solely on the data being presented.
Here’s how you can use the axis off command in your MATLAB script:
t = 1:0.01:2;
x = sin(2*pi*t);
y = cos(2*pi*t);
figure
plot(t,x)
xlabel('--time-->')
ylabel('--Amplitude-->')
axis off
Output:
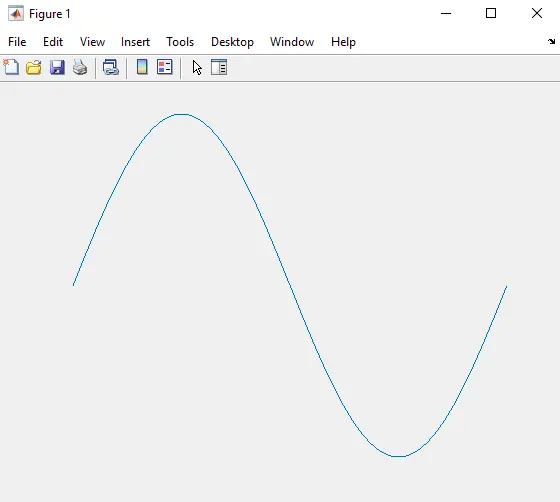
In this example, we first define a range of x values from 0 to 2 and compute the sine of each value. We then create a plot of these values using the plot() function. After plotting, the axis off command is called, which removes the axes entirely. This method is particularly useful when you’re creating figures for publications or presentations where the data’s visual impact is more important than the precise values on the axes.
Method 2: Using the set() Function
Another effective way to hide axes in MATLAB is by utilizing the set() function. This method provides more flexibility, allowing you to control various aspects of the axes individually. You can hide ticks, labels, and even the axis box itself.
Here’s how you can achieve this with the set() function:
t = 1:0.01:2;
x = sin(2*pi*t);
y = cos(2*pi*t);
figure
plot(t,x)
xlabel('--time-->')
ylabel('--Amplitude-->')
set(gca,'xtick',[],'ytick',[])
Output:
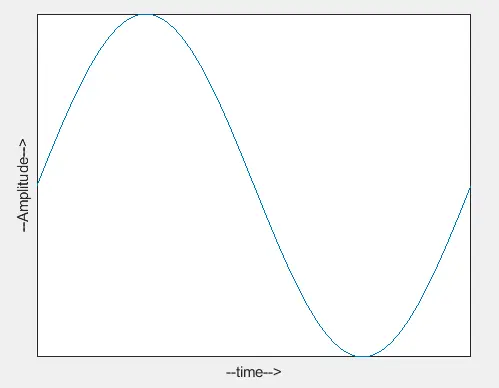
In this example, we again plot the sine function. After plotting, we call the set() function on the current axes (retrieved using gca). By setting XTick and YTick to empty arrays, we remove the ticks. Furthermore, by setting XColor and YColor to ’none’, we effectively hide the axis lines as well. This method gives you granular control over which elements of the axes you want to hide, making it ideal for customized visualizations.
Conclusion
Hiding axes in MATLAB can significantly enhance the clarity and aesthetic appeal of your plots. Whether you choose the straightforward axis off command or the more flexible set() function, mastering these techniques will help you create professional-looking visualizations. By focusing on the data without the distraction of axis ticks and labels, you can convey your message more effectively. So go ahead, experiment with these methods, and take your MATLAB skills to the next level!
FAQ
-
How can I hide only the x-axis in MATLAB?
You can hide just the x-axis by setting theXTickproperty to an empty array using theset()function. -
Will hiding the axes affect the data displayed in the plot?
No, hiding the axes will not affect the data. It only changes the visual representation. -
Can I hide the axes for specific plots in a single figure?
Yes, you can selectively hide axes for specific plots by calling theaxis offor using theset()function for the desired axes. -
Is it possible to restore the axes after hiding them?
Yes, you can restore the axes by simply using theaxis oncommand or by setting the properties back to their default values using theset()function. -
What other customization options are available for axes in MATLAB?
MATLAB provides numerous options for customizing axes, including changing colors, limits, and labels, among others.
