How to Modify ggplot X Axis Tick Labels in R
-
Use
scale_x_discreteto ModifyggplotX Axis Tick Labels in R -
Use
scale_x_discreteWith Custom Function to ModifyggplotX Axis Tick Labels in R
This article will introduce how to modify ggplot x-axis tick labels in R.
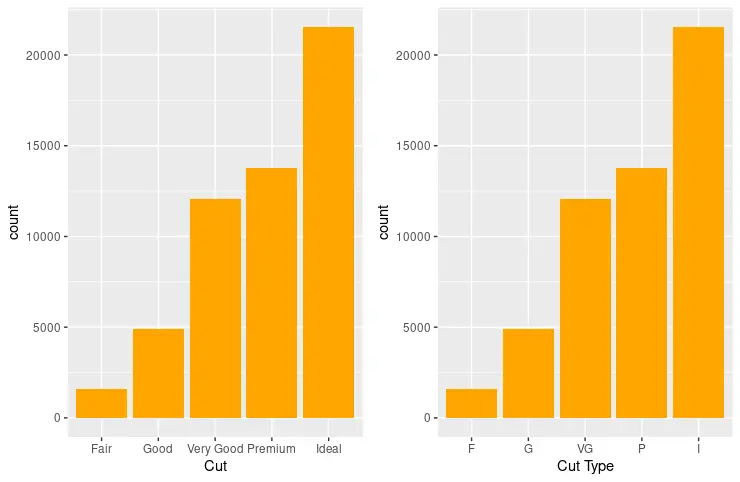
Use scale_x_discrete to Modify ggplot X Axis Tick Labels in R
scale_x_discrete together with scale_y_discrete are used for advanced manipulation of plot scale labels and limits. In this case, we utilize scale_x_discrete to modify x axis tick labels for ggplot objects. Notice that the first ggplot object is a bar graph based on the diamonds data set. The graph uses the cut column and plots the count of each type on the y axis. x axis has the default title - cut, which can be modified by passing the string as the first argument of scale_x_discrete. Alternatively, we can pass specific string values for each label by constructing a vector and assigning it to the labels parameter. Both graphs are drawn side-by-side using the grid.arrange function, part of the gridExtra package.
library(ggplot2)
library(gridExtra)

p1 <- ggplot(diamonds, aes(cut)) + geom_bar(fill = "orange") + scale_x_discrete("Cut")
p2 <- p1 + scale_x_discrete("Cut Type", labels = c("Fair" = "F","Good" = "G", "Very Good" = "VG","Premium" = "P","Ideal" = "I"))

grid.arrange(p1, p2, ncol = 2)
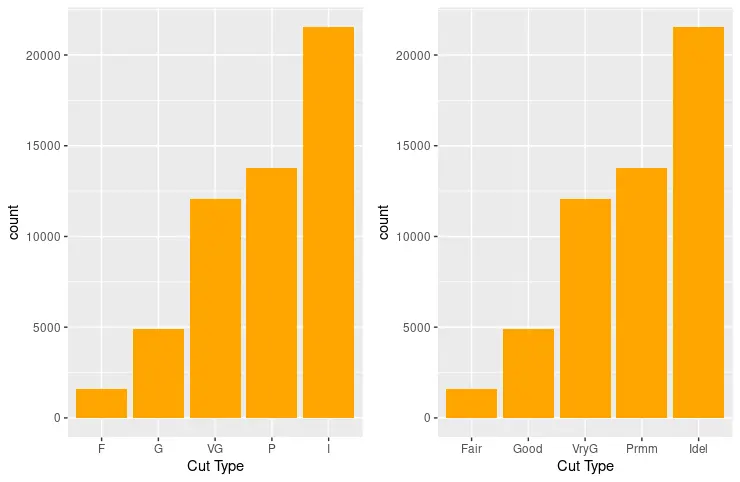
Another useful method to modify the labels on the x axis is to pass a function object as a labels parameter. The next code snippet uses the abbreviate function to automatically shorten the labels and then draw graphs as two columns.
library(ggplot2)
library(gridExtra)

p1 <- ggplot(diamonds, aes(cut)) + geom_bar(fill = "orange") + scale_x_discrete("Cut")
p2 <- p1 + scale_x_discrete("Cut Type", labels = c("Fair" = "F","Good" = "G", "Very Good" = "VG","Premium" = "P","Ideal" = "I"))
p3 <- p1 + scale_x_discrete("Cut Type", labels = abbreviate)

grid.arrange(p2, p3, ncol = 2)
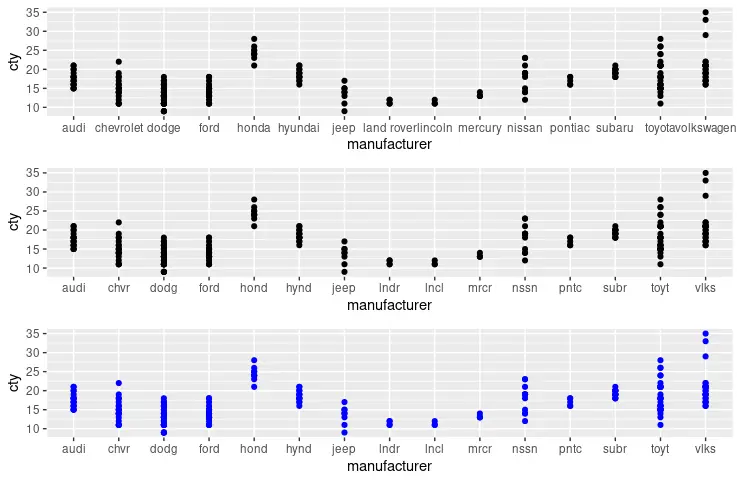
scale_x_discrete works similarly on different graphs, and the label manipulation technique is applicable, as shown in the following example. Namely, several scatter plots are drawn from the mpg data set.
library(ggplot2)
library(gridExtra)

p1 <- ggplot(mpg, aes(manufacturer, cty)) + geom_point()

p2 <- ggplot(mpg, aes(manufacturer, cty)) + geom_point() +
  scale_x_discrete(labels = abbreviate)

p3 <- ggplot(mpg, aes(manufacturer, cty)) + geom_point(colour = "blue") +
  scale_x_discrete(labels = abbreviate)

grid.arrange(p1, p2, p3, nrow = 3)
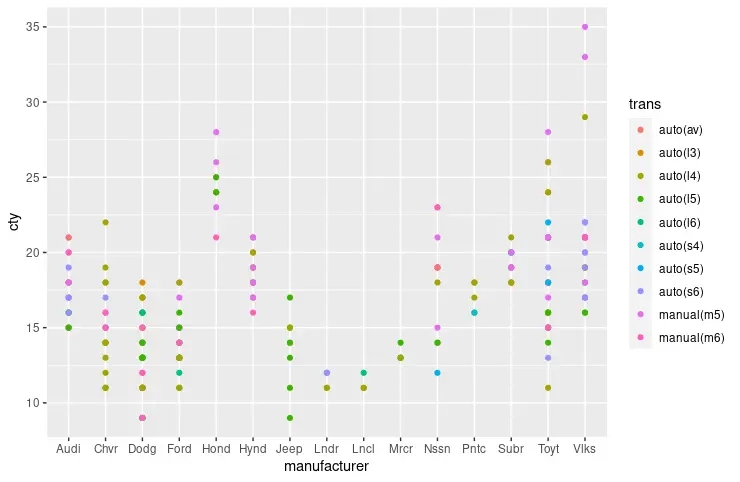
Use scale_x_discrete With Custom Function to Modify ggplot X Axis Tick Labels in R
scale_x_discrete parameter labels can take a custom function object to modify each tick label accordingly. In this case, we implemented the capitalize_all function that abbreviates each label first and then converts the starting character of the string to the capital letter. Note that paste, toupper, substring, and abbreviate built-in functions are utilized to implement capitalize_all functionality, but a full review of these methods are out of this article’s scope. Manual pages can be displayed using the ?function_name notation in the R console.
library(ggplot2)
library(gridExtra)

capitalize_all <- Vectorize(function(x) {
  s <- abbreviate(x)
  paste(toupper(substring(s, 1,1)), substring(s, 2), sep="", collapse=" ")
})

ggplot(mpg, aes(manufacturer, cty)) + geom_point(aes(colour = trans)) +
  scale_x_discrete(labels = capitalize_all)

Founder of DelftStack.com. Jinku has worked in the robotics and automotive industries for over 8 years. He sharpened his coding skills when he needed to do the automatic testing, data collection from remote servers and report creation from the endurance test. He is from an electrical/electronics engineering background but has expanded his interest to embedded electronics, embedded programming and front-/back-end programming.
LinkedIn Facebook