How to Add a Line to a Plot With the Lines() Function in R
-
Use the
lines()Function to Add a Line to a Plot in R -
Use
pointsto Add Points to a Plot in R -
plotandlinesFunction Call Order Affects the Scales of Plot

This article will introduce how to add a line to a plot with the lines() function in R.
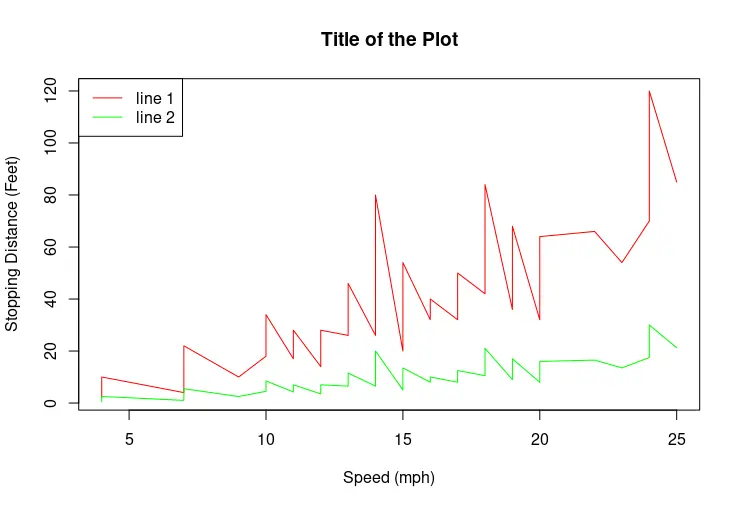
Use the lines() Function to Add a Line to a Plot in R
The lines() function is part of the R graphics package, and it’s used to add lines to the plot. At first, the plot function should be called to construct a plot where there is a mapping of variables specified by the first two arguments. Note that the second argument, which denotes the y-axis coordinates, is optional. Once the plot is drawn, we can call the lines() function and pass the coordinate vectors as needed to add lines to the plot. The plot function is not required to draw a line graph for the lines() function to work.
library(stats)
library(babynames)
library(dplyr)

plot(cars$speed, cars$dist, type = "l", col = "red",
     main = "Title of the Plot",
     xlab = "Speed (mph)",
     ylab = "Stopping Distance (Feet)")

lines(cars$speed, cars$dist/4 , col = "green")

legend("topleft", c("line 1", "line 2"),
       lty = c(1,1),
       col = c("red", "green"))
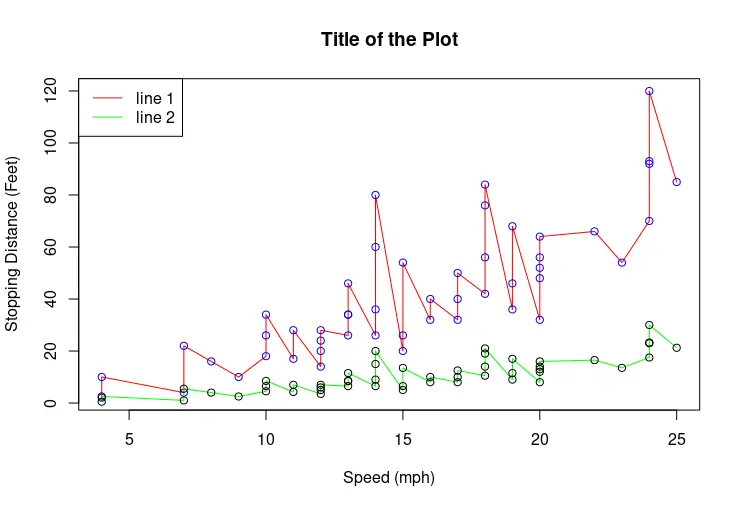
Use points to Add Points to a Plot in R
Similar to the lines() function, graphics package provides the points() function to draw points to the plot. The following example demonstrates the scenario where two lines and point mappings are made on the same plot. Notice, though, the original line graph is drawn with the plot function.
library(stats)
library(babynames)
library(dplyr)

plot(cars$speed, cars$dist, type = "l", col = "red",
     main = "Title of the Plot",
     xlab = "Speed (mph)",
     ylab = "Stopping Distance (Feet)")
points(cars$speed, cars$dist, col = "blue" )

lines(cars$speed, cars$dist/4 , col = "green")
points(cars$speed, cars$dist/4 , col = "black")

legend("topleft", c("line 1", "line 2"),
       lty = c(1,1),
       col = c("red", "green"))
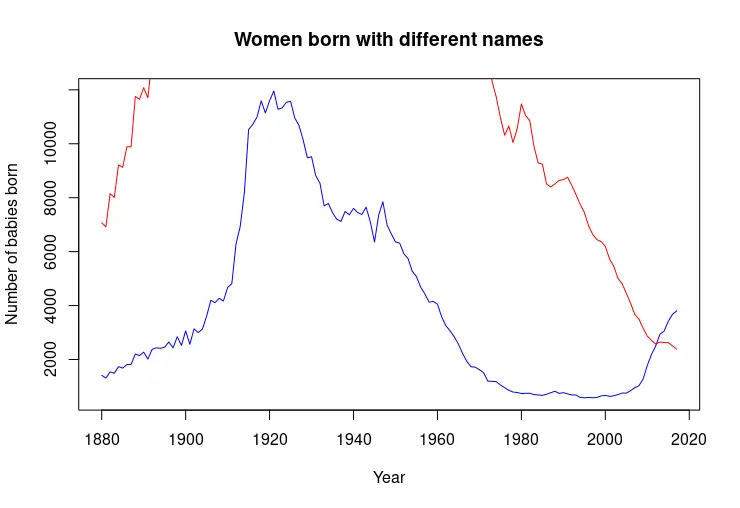
plot and lines Function Call Order Affects the Scales of Plot
Sometimes, the data mapped with the first function call has scales that are not enough for the following mapping. The next code snippet shows how one of the lines is almost out of bounds in the plot.
library(stats)
library(babynames)
library(dplyr)

dat <- babynames %>%
  filter(name %in% c("Alice")) %>% filter(sex=="F")
dat2 <- babynames %>%
  filter(name %in% c("Mary")) %>% filter(sex=="F")

plot(dat$year, dat$n, type = "l", col = "blue",
     main = "Women born with different names",
     xlab = "Year",
     ylab = "Number of babies born")
lines(dat2$year, dat2$n, col = "red")
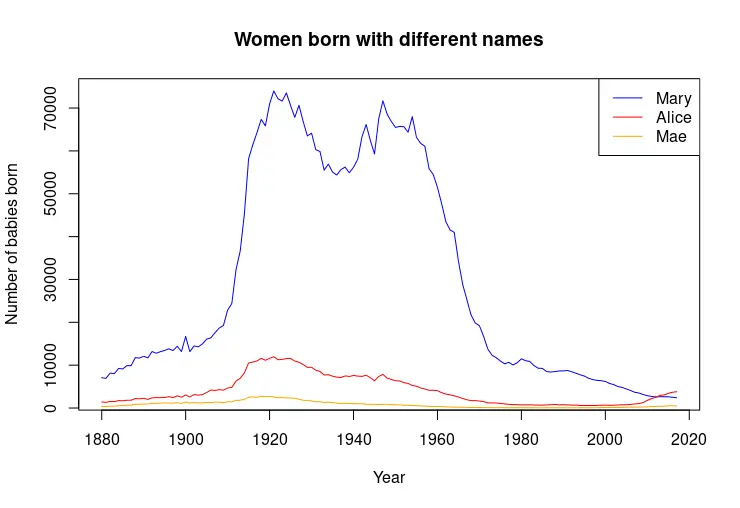
Note that the previous issue can be solved with manual reordering of the lines, as shown in the following example. Although, more complex scripts may need to construct conditional statements and dynamic checking for the maximum values of y-axis data.
library(stats)
library(babynames)
library(dplyr)

dat <- babynames %>%
  filter(name %in% c("Alice")) %>% filter(sex=="F")
dat2 <- babynames %>%
  filter(name %in% c("Mary")) %>% filter(sex=="F")
dat3 <- babynames %>%
  filter(name %in% c("Mae")) %>% filter(sex=="F")

plot(dat2$year, dat2$n, type = "l", col = "blue",
     main = "Women born with different names",
     xlab = "Year",
     ylab = "Number of babies born")
lines(dat$year, dat$n, col = "red")
lines(dat3$year, dat3$n, col = "orange")

legend("topright", c("Mary", "Alice", "Mae"),
       lty = c(1,1,1),
       col = c("blue", "red", "orange"))

Founder of DelftStack.com. Jinku has worked in the robotics and automotive industries for over 8 years. He sharpened his coding skills when he needed to do the automatic testing, data collection from remote servers and report creation from the endurance test. He is from an electrical/electronics engineering background but has expanded his interest to embedded electronics, embedded programming and front-/back-end programming.
LinkedIn Facebook