How to Make Quantile-Quantile Plot in Python
-
Quantile-Quantile Plot With the
statsmodelsPackage in Python -
Quantile-Quantile Plot With the
openturnsPackage in Python
This tutorial will introduce the methods to draw quantile-quantile plots in Python.
Quantile-Quantile Plot With the statsmodels Package in Python
A quantile-quantile plot is used to assess whether our data conforms to a particular distribution or not. It can be used to check whether the given dataset is normally distributed or not. We can use the statsmodels package to plot a quantile-quantile graph in Python. The command to install statsmodels is given below.
pip install statsmodels
The qqplot() function inside the statsmodels package plots quantile-quantile graphs. This function takes our data and the type of line to draw. The following code snippet shows us how to plot a quantile-quantile graph with the statsmodels package.
import numpy as np
import statsmodels.api as smi
import pylab

sample_data = np.random.normal(0, 1, 1000)

smi.qqplot(sample_data, line="r")
pylab.show()
Output:
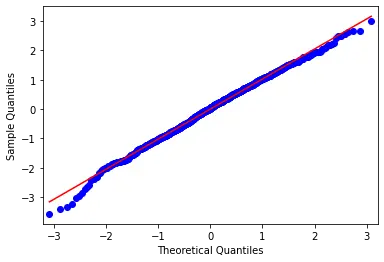
We plotted a quantile-quantile graph with the smi.qqplot(sample_data, line = "r") function in statsmodels package in the above code. We generated our normal data containing a 1000 entries with sample_data = np.random.normal(0,1, 1000) function. In the end, we used the pylab package to display our graph with pylab.show() function.
This method gives us complete control over the type of reference line to be plotted. In the above graph, we set the reference line to be a regression line.
Quantile-Quantile Plot With the openturns Package in Python
Another method for plotting a quantile-quantile graph in Python is by using the openturns package. It is an external package, so we need to install it before using it in our code. The command to install the openturns package is given below.
pip install openturns
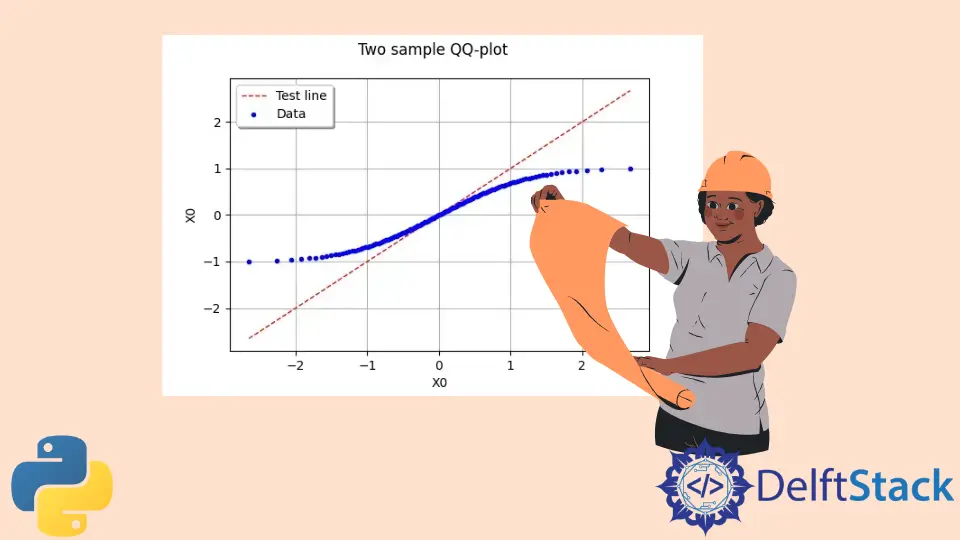
The VisualTest.DrawQQplot() function is used to plot quantile-quantile graphs inside the openturns package. This function’s first parameter needs to be sample data; the second parameter can either be another sample data or a distribution followed by another third parameter specifying the number of points. For this example, we will plot a normal distribution sample against a uniform distribution sample. The following code snippet shows us how to plot a quantile-quantile graph with the openturns package.
import openturns as ot

x = ot.Normal().getSample(1000000)
y = ot.Uniform().getSample(1000000)
g = ot.VisualTest.DrawQQplot(x, y)
g
Output:

We tested a sample from a normal distribution against a sample from a uniform distribution with the VisualTest.DrawQQplot(x, y) function in openturns package in the above code. We generated our sample data from normal distribution containing one million entries with x = ot.Normal().getSample(1000000). We generated our sample data from uniform distribution containing one million entries with y = ot.Uniform().getSample(1000000).
For further insights into plotting in Python, you might find the article on How to Use Gnuplot With Python helpful.
This method does not provide control over the reference/test line.

Maisam is a highly skilled and motivated Data Scientist. He has over 4 years of experience with Python programming language. He loves solving complex problems and sharing his results on the internet.
LinkedIn