How to Create Color Spectrums in Python

This tutorial will discuss the method to create images with color spectrum in Python.
Color Spectrum With the PIL Library in Python
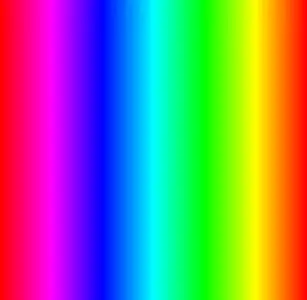
The dispersion of white light from the sun into its components after passing through a prism is called a color spectrum. It contains the entire range of light wavelengths visible to the naked human eye. In other words, a color spectrum contains the primary colors(red, green, and blue) and all the intermediate combinations of the primary colors. The Python Imaging Library PIL is used for working with images in Python. We can use the PIL library to create an image that contains our desired color spectrum. For the purpose of this tutorial, we will recreate the following color spectrum in an image with our desired dimensions using PIL in Python.
The following code example shows us how to recreate the same color spectrum inside an image of our desired dimensions with the PIL library.
from PIL import Image


def color_spectrum(height, width):

    spectrum_ratio = 255 * 6 / width

    red = 255
    green = 0
    blue = 0

    colors = []

    step = round(spectrum_ratio)

    for i in range(0, height):
        for j in range(0, 255 * 6 + 1, step):
            if j > 0 and j <= 255:
                blue += step
            elif j > 255 and j <= 255 * 2:
                red -= step
            elif j > 255 * 2 and j <= 255 * 3:
                green += step
            elif j > 255 * 3 and j <= 255 * 4:
                blue -= step
            elif j > 255 * 4 and j <= 255 * 5:
                red += step
            elif j > 255 * 5 and j <= 255 * 6:
                green -= step

            colors.append((red, green, blue))

    width2 = int(j / step + 1)

    image = Image.new("RGB", (width2, height))
    image.putdata(colors)
    image.save("Picture2.png", "PNG")


if __name__ == "__main__":
    create_spectrum(100, 300)
Output:
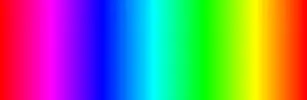
We replicated the same color spectrum as shown in the sample image with PIL in the above code.
We created an RGB image with image = Image.new("RGB", (width2, height)) and populated it with 8-bit color values with image.putdata(colors). Here, colors is a list of tuples where each tuple contains three values (red, green, and blue). As we know, 8-bit colors have values ranging from 0 to 255. We initialized three variables red, green, and blue, each representing the values of a primary color. The spectrum_ratio is used to simplify the computation. It represents for how many pixels do we see the same color. Our nested loop is incremented by one step because there is no need to loop through many different pixels having the same color. The step variable is calculated by rounding off the spectrum_ratio with step = round(spectrum_ratio).
As we can see that the color spectrum starts with red, gradually the red color starts to fade, and the blue color increases its intensity close to the middle of the image. When there is only blue color left in the color spectrum, the green color starts to intensify, and the blue color slowly starts to fade from left to right. When all the blue color has disappeared, and there is only the green color left, the intensity of the red color starts to increase again, and the green color starts to fade. The image ends when the green color has completely disappeared, and we are only left with the red color again.
The logic described in the previous paragraph has been encoded in our nested loop, and we append the new RGB values into our list colors after each iteration with colors.append((red, green, blue)). The image’s original width has been changed because we have rounded off the spectrum_ratio into step. We created width2 to cope with this change. After writing the color values into our new image, we saved the image with image.save("Picture2.png", "PNG").

Maisam is a highly skilled and motivated Data Scientist. He has over 4 years of experience with Python programming language. He loves solving complex problems and sharing his results on the internet.
LinkedInRelated Article - Python Graph
- Graphs Data Structure in Python
- How to Make Quantile-Quantile Plot in Python
- How to Smooth Data in Python