How to Use Gnuplot With Python

Gnuplot is an open-source command-line-driven interactive data plotting software. If you are a Gnuplot user and want to use it in Python, then you can easily do this with the help of two packages, Gnuplot and PyGnuplot.
We can also use Matplotlib for plotting in Python, but it isn’t as efficient as Gnuplot. On the other hand, Gnuplot is a 2D and 3D plotting utility that is good in performance and is much faster than Matplotlib.
Use Gnuplot With Gnuplot.py
Michael Haggerty developed the Gnuplot.py package. The prerequisite for this package is as follows.
- Install Gnuplot software.
- Install Python (any from version 2.2 to 3).
- Install the NumPy package in Python with the help of
pip.
To install the Gnuplot package in Python, we have to follow these steps in Windows:
-
Download the
Gnuplot.pypackage from Gnuplot.py. -
Open the command prompt.
-
Move to the
Gnuplot.pylocation in the command prompt. -
Enter this command:
python setup.py install
As you install the Gnuplot.py package, numpy, you can use this code to access Gnuplot software.
# import libraries
import numpy as np
import Gnuplot

# assign x range 0 to 100
x = np.arange(100)

# assign y range of x square
y = x ** 2

# load Gnuplot software
g = Gnuplot.Gnuplot()
d = Gnuplot.Data(x, y, with_="lp")

# plot line point on the base of x and y
g.plot(d)
Output:
Use Gnuplot With pyGnuplot
Gnuplot has no support nowadays, so we can use Gnuplot in Python by importing the pyGnuplot package, a built-in package with Python’s latest versions. It is a wrapper of the Gnuplot software.
We must follow these steps in Windows to install the pyGnuplot package in Python.
-
Move to the
python.exelocation. -
Press shift and right-click on a given location.
-
Select
open powershell windowfrom the popup menu. -
Install
PyGnuplotusingpip. Enter this command:pip install PyGnuplot
Once it is successfully installed, we can then use it.
Now, let’s see a few examples of the PyGnuplot package.
Example Code of sin(x):
from PyGnuplot import gp

# Write path of your gnuplot.exe
fig1 = gp(r"C:\Program Files\gnuplot\bin\gnuplot.exe")

# a stand for ask gnuplot; it send command to gnuplot
fig1.a("plot sin(x)")
Output:
.webp)
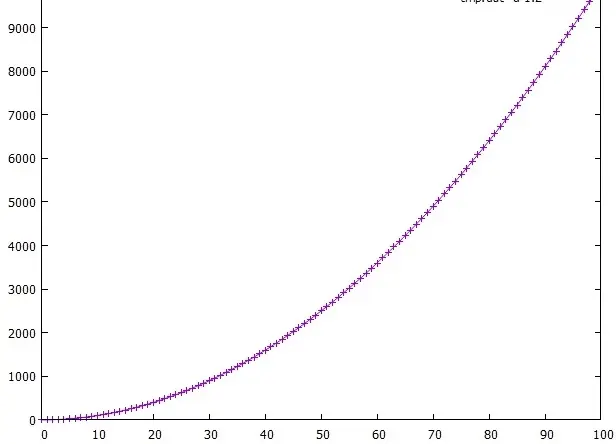
Use the default data file of Gnuplot:
# same example Written for Gnuplot.py

# import libraries
from PyGnuplot import gp
import numpy as np

# x range till 100
x = np.arange(100)

# y is equal to the square of x
y = x ** 2

# Write the path of your gnuplot.exe
fig1 = gp(r"C:\Program Files\gnuplot\bin\gnuplot.exe")

# by default, save tmp.dat data file
fig1.save([x, y])

# give the command to gnuplot to plot the data file using columns 1 and 2 to draw line points
fig1.c('plot "tmp.dat" u 1:2 w lp')
Output:

We can use the pdf() method to save the graph in PDF format.
fig1.pdf("figure.pdf") # outputs pdf file
We can use fit and fit2d functions to fit quickly with Gnuplot. We can use the ps function to make Gnuplot print into a postscript.
We can see many other methods in PyGnuplot’s documentation.
Conclusion
Gnuplot is much better in performance than Matplotlib, and as a Gnuplot user, you don’t need to shift on Matplotlib. You don’t need to learn new terms when you are an expert in the Gnuplot software, so we can easily use Gnuplot.py and PyGnuplot packages in Python for Gnuplot software.

Zeeshan is a detail oriented software engineer that helps companies and individuals make their lives and easier with software solutions.
LinkedIn