Python과 함께 Gnuplot 사용

Gnuplot은 오픈 소스 명령줄 기반 대화형 데이터 플로팅 소프트웨어입니다. Gnuplot 사용자이고 Python에서 사용하려는 경우 Gnuplot과 PyGnuplot의 두 패키지를 사용하여 쉽게 수행할 수 있습니다.
Python에서 플로팅을 위해 Matplotlib를 사용할 수도 있지만 Gnuplot만큼 효율적이지는 않습니다. 반면 Gnuplot은 성능이 좋고 Matplotlib보다 훨씬 빠른 2D 및 3D 플로팅 유틸리티입니다.
Gnuplot.py와 함께 Gnuplot 사용
Michael Haggerty는 Gnuplot.py 패키지를 개발했습니다. 이 패키지의 전제 조건은 다음과 같습니다.
- Gnuplot 소프트웨어를 설치합니다.
- Python(버전 2.2~3)을 설치합니다.
pip의 도움으로 Python에 NumPy 패키지를 설치합니다.
Python에서 Gnuplot 패키지를 설치하려면 Windows에서 다음 단계를 따라야 합니다.
-
Gnuplot.py에서
Gnuplot.py패키지를 다운로드합니다. -
명령 프롬프트를 엽니다.
-
명령 프롬프트에서
Gnuplot.py위치로 이동합니다. -
다음 명령을 입력하십시오.
python setup.py install
Gnuplot.py 패키지인 numpy를 설치하면 이 코드를 사용하여 Gnuplot 소프트웨어에 액세스할 수 있습니다.
# import libraries
import numpy as np
import Gnuplot

# assign x range 0 to 100
x = np.arange(100)

# assign y range of x square
y = x ** 2

# load Gnuplot software
g = Gnuplot.Gnuplot()
d = Gnuplot.Data(x, y, with_="lp")

# plot line point on the base of x and y
g.plot(d)
출력:
pyGnuplot과 함께 Gnuplot 사용
현재 Gnuplot은 지원하지 않으므로 Python의 최신 버전에 내장된 패키지인 pyGnuplot 패키지를 가져와서 Python에서 Gnuplot을 사용할 수 있습니다. Gnuplot 소프트웨어의 래퍼입니다.
Python에서 pyGnuplot 패키지를 설치하려면 Windows에서 다음 단계를 따라야 합니다.
-
python.exe위치로 이동합니다. -
shift를 누르고 지정된 위치를 마우스 오른쪽 버튼으로 클릭합니다.
-
팝업 메뉴에서
powershell 창 열기를 선택합니다. -
pip를 사용하여PyGnuplot을 설치합니다. 다음 명령을 입력하십시오.pip install PyGnuplot
성공적으로 설치되면 사용할 수 있습니다.
이제 PyGnuplot 패키지의 몇 가지 예를 살펴보겠습니다.
sin(x)의 예제 코드:
from PyGnuplot import gp

# Write path of your gnuplot.exe
fig1 = gp(r"C:\Program Files\gnuplot\bin\gnuplot.exe")

# a stand for ask gnuplot; it send command to gnuplot
fig1.a("plot sin(x)")
출력:
.webp)
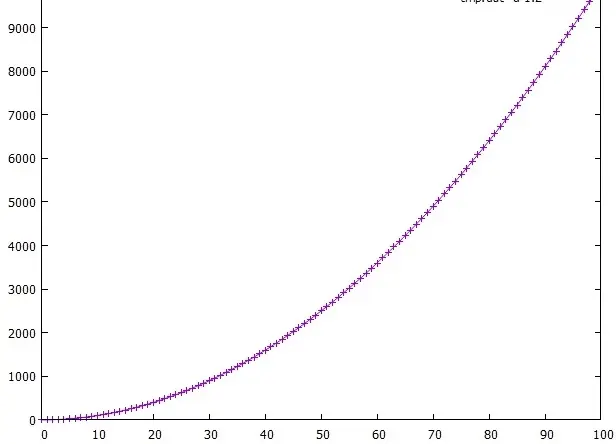
Gnuplot의 기본 데이터 파일 사용:
# same example Written for Gnuplot.py

# import libraries
from PyGnuplot import gp
import numpy as np

# x range till 100
x = np.arange(100)

# y is equal to the square of x
y = x ** 2

# Write the path of your gnuplot.exe
fig1 = gp(r"C:\Program Files\gnuplot\bin\gnuplot.exe")

# by default, save tmp.dat data file
fig1.save([x, y])

# give the command to gnuplot to plot the data file using columns 1 and 2 to draw line points
fig1.c('plot "tmp.dat" u 1:2 w lp')
출력:

pdf() 메서드를 사용하여 그래프를 PDF 형식으로 저장할 수 있습니다.
fig1.pdf("figure.pdf") # outputs pdf file
fit 및 fit2d 기능을 사용하여 Gnuplot에 빠르게 맞출 수 있습니다. ps 기능을 사용하여 Gnuplot을 포스트스크립트로 인쇄할 수 있습니다.
PyGnuplot의 문서에서 다른 많은 방법을 볼 수 있습니다.
결론
Gnuplot은 Matplotlib보다 성능면에서 훨씬 뛰어나며 Gnuplot 사용자는 Matplotlib로 전환할 필요가 없습니다. Gnuplot 소프트웨어의 전문가라면 새로운 용어를 배울 필요가 없으므로 Python for Gnuplot 소프트웨어에서 Gnuplot.py 및 PyGnuplot 패키지를 쉽게 사용할 수 있습니다.

Zeeshan is a detail oriented software engineer that helps companies and individuals make their lives and easier with software solutions.
LinkedIn