Python で Gnuplot を使用する

Gnuplot は、オープンソースのコマンドライン駆動型の対話型データ プロット ソフトウェアです。 Gnuplot のユーザーで、Python で使用したい場合は、Gnuplot と PyGnuplot の 2つのパッケージを使用して簡単に行うことができます。
Python でのプロットに Matplotlib を使用することもできますが、Gnuplot ほど効率的ではありません。 一方、Gnuplot は 2D および 3D プロット ユーティリティであり、パフォーマンスが高く、Matplotlib よりもはるかに高速です。
Gnuplot.py で Gnuplot を使用する
Michael Haggerty は Gnuplot.py パッケージを開発しました。 このパッケージの前提条件は次のとおりです。
- Gnuplot ソフトウェアをインストールします。
- Python (バージョン 2.2 から 3 のいずれか) をインストールします。
pipを使用して Python に NumPy パッケージをインストールします。
Gnuplot パッケージを Python にインストールするには、Windows で次の手順に従う必要があります。
-
Gnuplot.py から
Gnuplot.pyパッケージをダウンロードします。 -
コマンド プロンプトを開きます。
-
コマンド プロンプトで
Gnuplot.pyの場所に移動します。 -
次のコマンドを入力します。
python setup.py install
Gnuplot.py パッケージ、numpy をインストールすると、このコードを使用して Gnuplot ソフトウェアにアクセスできます。
# import libraries
import numpy as np
import Gnuplot

# assign x range 0 to 100
x = np.arange(100)

# assign y range of x square
y = x ** 2

# load Gnuplot software
g = Gnuplot.Gnuplot()
d = Gnuplot.Data(x, y, with_="lp")

# plot line point on the base of x and y
g.plot(d)
出力:
pyGnuplot で Gnuplot を使用する
Gnuplot は現在サポートされていないため、Python の最新バージョンの組み込みパッケージである pyGnuplot パッケージをインポートすることで、Python で Gnuplot を使用できます。 Gnuplot ソフトウェアのラッパーです。
Python で pyGnuplot パッケージをインストールするには、Windows で次の手順に従う必要があります。
-
python.exeの場所に移動します。 -
shift を押して、特定の場所を右クリックします。
-
ポップアップ メニューから
open powershell windowを選択します。 -
pipを使用してPyGnuplotをインストールします。 次のコマンドを入力します。pip install PyGnuplot
正常にインストールされたら、それを使用できます。
それでは、PyGnuplot パッケージの例をいくつか見てみましょう。
sin(x) のコード例:
from PyGnuplot import gp

# Write path of your gnuplot.exe
fig1 = gp(r"C:\Program Files\gnuplot\bin\gnuplot.exe")

# a stand for ask gnuplot; it send command to gnuplot
fig1.a("plot sin(x)")
出力:
.webp)
Gnuplot のデフォルトのデータ ファイルを使用します。
# same example Written for Gnuplot.py
# import libraries
from PyGnuplot import gp
import numpy as np
# x range till 100
x = np.arange(100)
# y is equal to the square of x
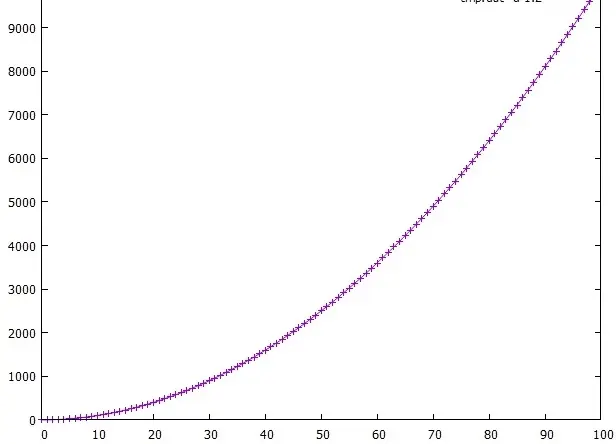
y = x ** 2
# Write the path of your gnuplot.exe
fig1 = gp(r"C:\Program Files\gnuplot\bin\gnuplot.exe")
# by default, save tmp.dat data file
fig1.save([x, y])
# give the command to gnuplot to plot the data file using columns 1 and 2 to draw line points
fig1.c('plot "tmp.dat" u 1:2 w lp')
出力:

pdf() メソッドを使用して、グラフを PDF 形式で保存できます。
fig1.pdf("figure.pdf") # outputs pdf file
fit および fit2d 関数を使用して、Gnuplot にすばやく適合させることができます。 ps 関数を使用して、Gnuplot を PostScript に出力できます。
PyGnuplot のドキュメントには、他にも多くのメソッドがあります。
まとめ
Gnuplot は Matplotlib よりもパフォーマンスがはるかに優れており、Gnuplot ユーザーとして Matplotlib に移行する必要はありません。 Gnuplot ソフトウェアの専門家であれば、新しい用語を学ぶ必要はありません。そのため、Python で Gnuplot ソフトウェア用の Gnuplot.py および PyGnuplot パッケージを簡単に使用できます。

Zeeshan is a detail oriented software engineer that helps companies and individuals make their lives and easier with software solutions.
LinkedIn