在 Python 中绘制分位数图
本教程将介绍在 Python 中绘制分位数图的方法。
使用 Python 中的 statsmodels 包绘制分位数图
分位数-分位数图用于评估我们的数据是否符合特定分布。它可用于检查给定数据集是否为正态分布。我们可以使用 statsmodels 包 在 Python 中绘制分位数-分位数图。下面给出了安装 statsmodels 的命令。
pip install statsmodels
statsmodels 包中的 qqplot() 函数绘制分位数-分位数图。这个函数需要我们的数据和要绘制的线的类型。以下代码片段向我们展示了如何使用 statsmodels 包绘制分位数-分位数图。
import numpy as np
import statsmodels.api as smi
import pylab

sample_data = np.random.normal(0, 1, 1000)

smi.qqplot(sample_data, line="r")
pylab.show()
输出:
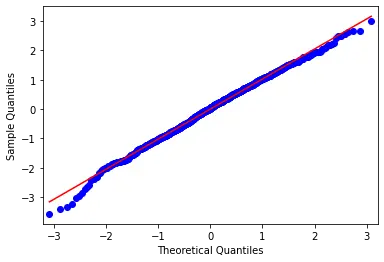
在上面的代码中,我们使用 statsmodels 包中的 smi.qqplot(sample_data, line = "r") 函数绘制了分位数-分位数图。我们使用 sample_data = np.random.normal(0,1, 1000) 函数生成了包含 1000 个条目的正常数据。最后,我们使用 pylab 包通过 pylab.show() 函数显示我们的图表。
这种方法使我们可以完全控制要绘制的参考线的类型。在上图中,我们将参考线设置为回归线。
使用 Python 中的 openturns 包绘制分位数-分位数图
在 Python 中绘制分位数-分位数图的另一种方法是使用 openturns 包。它是一个外部包,因此我们需要先安装它,然后才能在我们的代码中使用它。下面给出了安装 openturns 软件包的命令。
pip install openturns
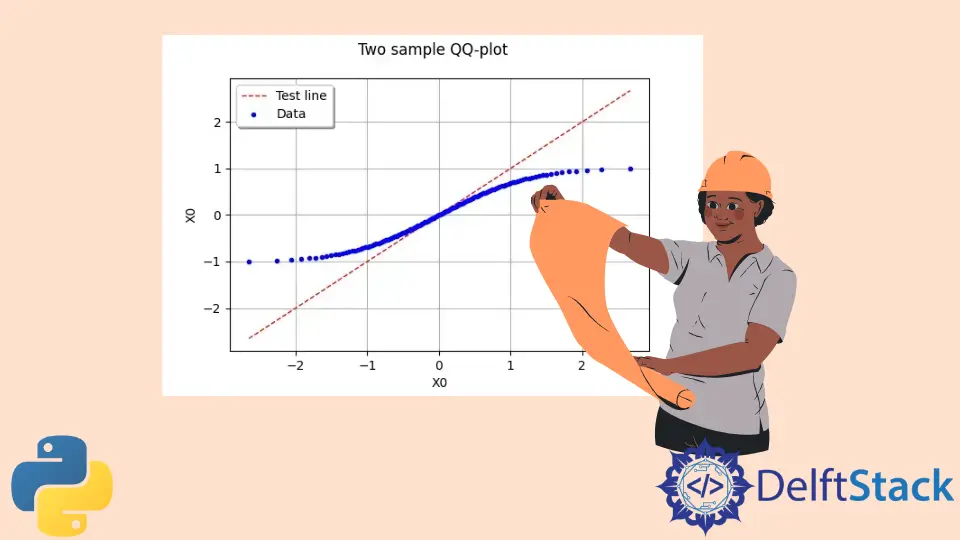
VisualTest.DrawQQplot() 函数用于在 openturns 包内绘制分位数-分位数图。这个函数的第一个参数需要是样本数据;第二个参数可以是另一个样本数据,也可以是一个分布,然后是另一个指定点数的第三个参数。对于此示例,我们将针对均匀分布样本绘制正态分布样本。以下代码片段向我们展示了如何使用 openturns 包绘制分位数-分位数图。
import openturns as ot

x = ot.Normal().getSample(1000000)
y = ot.Uniform().getSample(1000000)
g = ot.VisualTest.DrawQQplot(x, y)
g
输出:

在上面的代码中,我们使用 openturns 包中的 VisualTest.DrawQQplot(x, y) 函数测试了来自正态分布的样本与来自均匀分布的样本。我们从包含一百万个条目的正态分布中生成了样本数据,其中包含 x = ot.Normal().getSample(1000000)。我们从包含一百万个条目的均匀分布中生成我们的样本数据,其中 y = ot.Uniform().getSample(1000000)。
此方法不提供对参考/测试线的控制。

Maisam is a highly skilled and motivated Data Scientist. He has over 4 years of experience with Python programming language. He loves solving complex problems and sharing his results on the internet.
LinkedIn