How to Calculate the Cumulative Distribution Function in Python
-
Use
numpy.arange()to Calculate the CDF in Python -
Use
numpy.linspace()to Calculate the CDF in Python

The term cumulative distribution function or CDF is a function y=f(x), where y represents the probability of the integer x, or any number lower than x, being randomly selected from a distribution.
It is calculated in Python by using the following functions from the NumPy library.
numpy.arange()function which returns anndarrayof evenly spaced values.numpy.linspace()function which returns anndarrayof evenly spaced values within a given interval.
Use numpy.arange() to Calculate the CDF in Python
The NumPy standard library contains the arange() function used to determine the CDF in Python.
For this, import the NumPy library first.
The arange() function returns an ndarray of evenly spaced values.
Below is an example that demonstrates the implementation of the CDF function using the numpy.arange() function in Python.
import matplotlib.pyplot as plt
import numpy

data = numpy.random.randn(5)
print("The data is-", data)
sorted_random_data = numpy.sort(data)
p = 1.0 * numpy.arange(len(sorted_random_data)) / float(len(sorted_random_data) - 1)
print("The CDF result is-", p)

fig = plt.figure()
fig.suptitle("CDF of data points")
ax2 = fig.add_subplot(111)
ax2.plot(sorted_random_data, p)
ax2.set_xlabel("sorted_random_data")
ax2.set_ylabel("p")
Here, the randn() function is used to return samples of data using the standard normal distribution. Since randn(5) is mentioned, a 1Darray is built with 5 random values.
Next, the data is sorted using the sort() function, after which the arange() function is used to calculate the CDF.
Output:
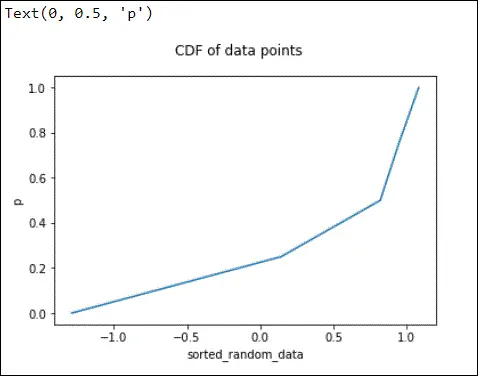
The data is- [ 0.14213322 -1.28760908  0.94533922  0.82004319  1.08232731]
The CDF result is- [0.   0.25 0.5  0.75 1.  ]
The graph is displayed as per the CDF function as.
Use numpy.linspace() to Calculate the CDF in Python
The NumPy standard library contains the linspace() function used to determine the CDF in Python. For this, import the NumPy library first.
The linspace() function returns an ndarray of evenly spaced numbers over a specified interval.
Here is an example that demonstrates the implementation of the CDF function using numpy.linspace() in Python.
import matplotlib.pyplot as plt
import numpy as np

data = np.random.randn(5)
print("The data is-", data)
sorted_random_data = np.sort(data)
np.linspace(0, 1, len(data), endpoint=False)

print("The CDF result using linspace =\n", p)

fig = plt.figure()
fig.suptitle("CDF of data points")
ax2 = fig.add_subplot(111)
ax2.plot(sorted_random_data, p)
ax2.set_xlabel("sorted_random_data")
ax2.set_ylabel("p")
Here, the randn() function is used to return samples of data using the standard normal distribution. Next, the data is sorted using the sort() function, after which the arange() function is used to calculate the CDF.
Output:
The data is- [-0.92106668 -0.05998132  0.02102705 -0.84778184  0.90815869]
The CDF result using linspace =
 [0.   0.25 0.5  0.75 1.  ]
The graph is displayed as per the CDF function as below.
