How to Plot Value Counts in Descending Order in Pandas

The main aim of this article is to demonstrate how we can plot values in a graph in descending order with the help of Matplotlib in Python.
Plot Value Counts in Pandas
The Problem
A large amount of data can be stored and accessed at any given time using the Dataframe, depending on the need and situation. It provides flexibility to store multiple data types into a single, ordered data structure for custom usage.
While Dataframe stores data, it is sometimes also necessary to visualize it. Using Matplotlib, visualizing data is quite easy.
Depending on the scenario, it can be the case that we may have to visualize the data in a descending form.
Consider the following code:
import pandas as pd
import matplotlib.pyplot as plt


keyItems = ("a", "a", "a", "a", "a", "b", "b", "b", "b", "b", "c", "c", "c", "d")
idData = ("X", "X", "X", "X", "X", "X", "X", "X", "Y", "X", "X", "X", "X", "X")

df = pd.DataFrame({"keys": keyItems, "ids": idData})
print("\nDataframe:\n" + str(df))
print("\nValue Counts:\n" + str(df.value_counts()))

df.value_counts().plot(kind="barh")

plt.show()
Output:
Dataframe:
   keys ids
0     a   X
1     a   X
2     a   X
3     a   X
4     a   X
5     b   X
6     b   X
7     b   X
8     b   Y
9     b   X
10    c   X
11    c   X
12    c   X
13    d   X

Value Counts:
keys  ids
a     X      5
b     X      4
c     X      3
b     Y      1
d     X      1
dtype: int64
The plot:
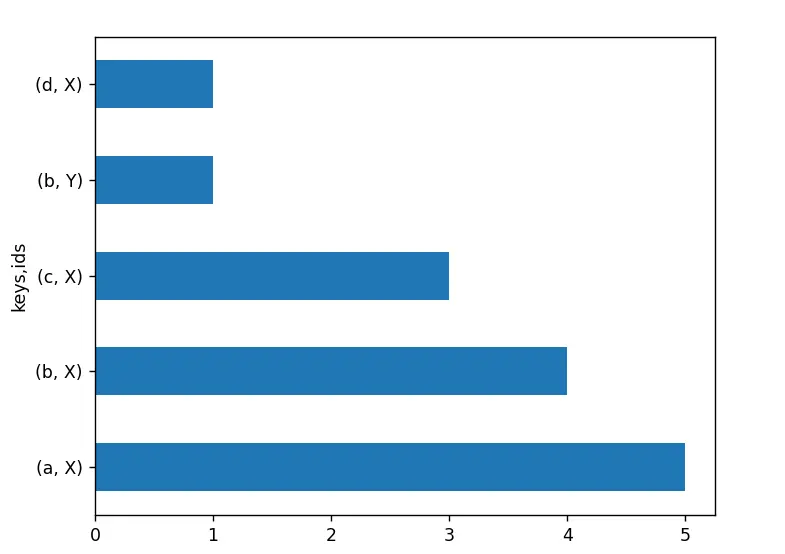
From the code mentioned above, it can be seen that keys and their corresponding ids have been declared separately, with all the keys being stored in a variable named keyItems and their corresponding ids being stored in a variable named idData.
After instantiating the Dataframe, we check how often a certain value occurred using the value_counts method. After that, we plot the graph and show it on the screen using the show method, which is a part of the matplotlib.plot.
From the plot, it can be seen that the graph is plotted in an ascending manner. Based on the requirement of the project or some other scenario, it can be a possibility that it is required to plot the graph in a descending manner instead of the ascending order being shown in the output graph.
The Solution
With the addition of sort_values() before plotting the graph, it is possible to sort values in descending order, which results in the largest values coming on top, whereas the smallest on the bottom of the output.
Consider the following code:
df.value_counts().sort_values().plot(kind="barh")
The following code demonstrates the effect of sort_values() on the value_counts().
print("\nValue Counts:\n" + str(df.value_counts()))
print("\nValue Counts - Sorted:\n" + str(df.value_counts().sort_values()))
Full code:
import pandas as pd
import matplotlib.pyplot as plt

keyItems = ("a", "a", "a", "a", "a", "b", "b", "b", "b", "b", "c", "c", "c", "d")
idData = ("X", "X", "X", "X", "X", "X", "X", "X", "Y", "X", "X", "X", "X", "X")

df = pd.DataFrame({"keys": keyItems, "ids": idData})
print("\nValue Counts:\n" + str(df.value_counts()))
print("\nValue Counts - Sorted:\n" + str(df.value_counts().sort_values()))

df.value_counts().sort_values().plot(kind="barh")
plt.show()
Output:
Value Counts:
keys  ids
a     X      5
b     X      4
c     X      3
b     Y      1
d     X      1
dtype: int64

Value Counts - Sorted:
keys  ids
b     Y      1
d     X      1
c     X      3
b     X      4
a     X      5
The Plot:
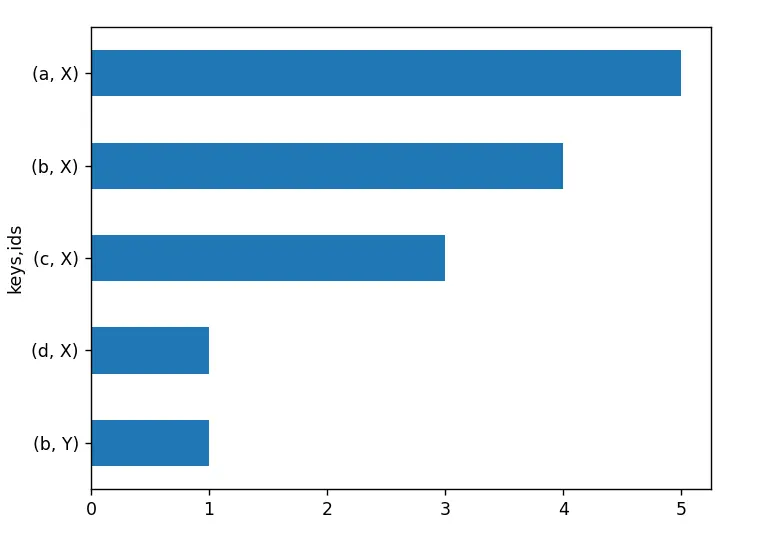
It is possible to sort the output of values_count in descending order using the sort_values method, with the largest occurrence showing on the top of the graph and the smallest being on the very bottom of the output plot.
Should the need arise, it is also possible to sort the values_count by index instead of values using the sort_index method.

Hello! I am Salman Bin Mehmood(Baum), a software developer and I help organizations, address complex problems. My expertise lies within back-end, data science and machine learning. I am a lifelong learner, currently working on metaverse, and enrolled in a course building an AI application with python. I love solving problems and developing bug-free software for people. I write content related to python and hot Technologies.
LinkedIn