How to Plot Heatmap in Plotly
-
Use
imshow()Function of Plotly to Create Heatmap in Python -
Use
Heatmap()Function of Plotly to Create Heatmap in Python
This tutorial will discuss creating a heatmap using the imshow() and Heatmap() function of Plotly in Python.
Use imshow() Function of Plotly to Create Heatmap in Python
A heatmap represents data as colored rectangles in which the color varies according to a color scale. We can use the imshow() function of plotly.express to create a heatmap of the given data.
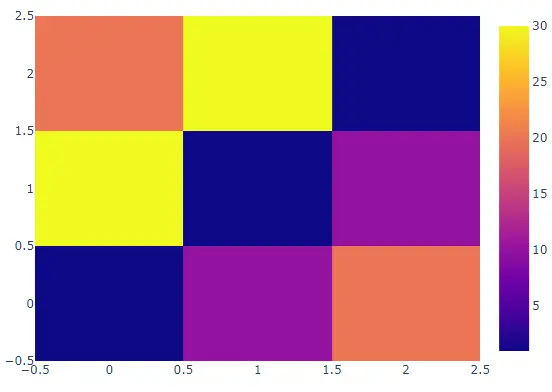
The imshow() function excepts only 2D data as input. For example, let’s create a 2D matrix and pass it inside the imshow() function. See the code below.
import plotly.express as px

data = [[1, 10, 20], [30, 1, 10], [20, 30, 1]]
fig = px.imshow(data)
fig.show()
Output:
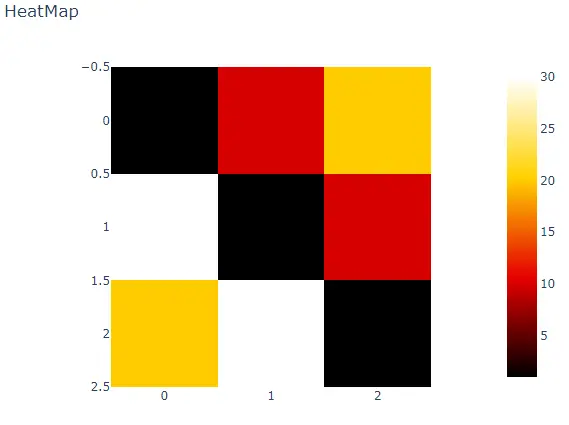
The imshow() function gave each triangle a different color according to its value using the default color sequence. We can change the default color sequence using the color_continuous_scale argument and setting its value to a supported color sequence name like hot and HSV.
To convert the heatmap chart into a group of subplots containing a single column in each subplot, we can use the facet_col for columns and set its value to a list of integers or strings used to set the name of the subplot.
We can also change the spacing between each subplot using the facet_col_spacing argument and setting its value to a floating-point number from 0 to 1. We can change the plot’s title using the title argument.
We can change the width and height of the plot using the width and height arguments. We can use the aspect argument to set the size of each rectangle equal to the other.
For example, let’s change the properties mentioned above. See the code below.
import plotly.express as px

data = [[1, 10, 20], [30, 1, 10], [20, 30, 1]]
fig = px.imshow(
    data,
    color_continuous_scale="hot",
    title="HeatMap",
    width=600,
    height=500,
    aspect="equal",
)
fig.show()
Output:
Use Heatmap() Function of Plotly to Create Heatmap in Python
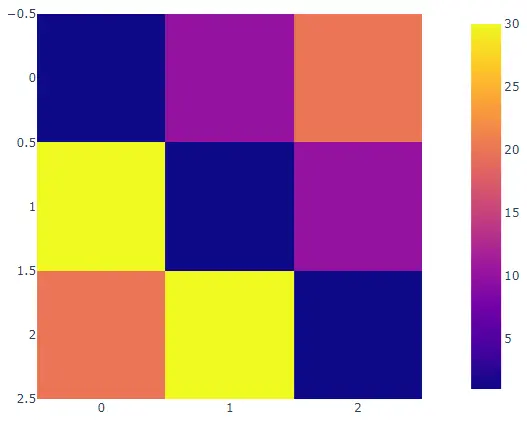
We can also use the Heatmap() function of plotly.graph_objects to create a heatmap of the given data. We must pass the x, y, and z-axis values inside the Heatmap() function.
The z-axis values belong to the color of the heatmap. If we only pass the z-axis values, the other two axis values will be taken from the matrix indices.
Let’s use a random matrix to create a heatmap. See the code below.
import plotly.graph_objects as go

z = [[1, 10, 20], [30, 1, 10], [20, 30, 1]]
data = go.Heatmap(z=z)
fig = go.Figure(data)
fig.show()
Output:
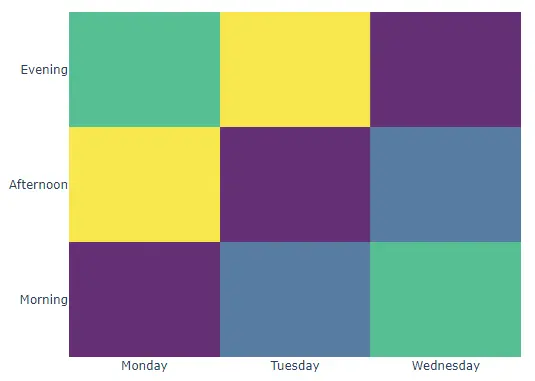
We can set the x and y-axis values to a list of strings or integers, but the size should be the same as the number of columns of the input z matrix.
We can also change the default color sequence using the colorscale argument and setting its value to a supported color sequence name like hot and Viridis.
We can change the opacity of the plot using the opacity argument and setting its value from 0 to 1.
We can also hide the hover information using the hoverinfo argument and setting its value to skip. We can hide the color bar using the showscale argument and setting its value to false.
Let’s change the properties mentioned above. See the code below.
import plotly.graph_objects as go

z = [[1, 10, 20], [30, 1, 10], [20, 30, 1]]
data = go.Heatmap(
    z=z,
    x=["Monday", "Tuesday", "Wednesday"],
    y=["Morning", "Afternoon", "Evening"],
    hoverongaps=False,
    colorscale="Viridis",
    opacity=0.8,
    hoverinfo="skip",
    showscale=False,
)
fig = go.Figure(data)
fig.show()
Output: