How to Make a Square Plot With Equal Axes in Matplotlib
-
Use
set_aspect()to Make a Square Plot With Equal Axes in Matplotlib -
Use the
axis()Method to Make a Square Plot With Equal Axes in Matplotlib - Conclusion

Matplotlib, a widely-used data visualization library in Python, offers various techniques to create plots with equal axes, resulting in a square aspect ratio. The aspect ratio of a plot is the ratio between the height and width of the plot.
In a square plot, this ratio is 1:1, meaning the height and width are equal. This ensures that the units along both axes are of equal length, providing an accurate representation of the data.
This guide will explore different methods to achieve this, providing detailed examples and thorough explanations for each approach.
Use set_aspect() to Make a Square Plot With Equal Axes in Matplotlib
One straightforward method to achieve a square plot with equal axes is by using the set_aspect('equal') function in Matplotlib.
We can set the aspect ratio using matplotlib.axes.Axes.set_aspect() function. If we use 'equal' as an aspect ratio in the function, we get a plot with the same scaling from data points to plot units for X-axis and Y-axis.
Syntax:
ax.set_aspect(aspect, adjustable=None, anchor=None, share=False)
-
aspect: This parameter determines the aspect ratio of the plot. It can take different forms:- If it is a scalar (e.g.,
1,2,0.5), it sets the aspect ratio of the plot directly. - If it is a string (e.g.,
'equal','auto'), it specifies a predefined aspect ratio.'equal'sets a 1:1 aspect ratio, while'auto'allows Matplotlib to choose the aspect ratio automatically.
- If it is a scalar (e.g.,
-
adjustable: This parameter controls how the aspect ratio is adjusted when the plot size changes. It can take one of the following values:'box': The aspect ratio is adjusted by changing the dimensions of the entire plot (including labels, ticks, etc.).'datalim': The aspect ratio is adjusted by changing the data limits without changing the size of the plot.
-
anchor: This parameter specifies which point of the plot should be used as the reference for setting the aspect ratio. It can take values like'C'(center),'SW'(southwest),'NE'(northeast), etc. -
share: This parameter, if set toTrue, allows the aspect ratio to be shared among multiple subplots in a figure.
Example Code:
import numpy as np
import matplotlib.pyplot as plt

x = np.linspace(-3, 3, 100)
y = np.sin(x)

fig = plt.figure()
ax = fig.add_subplot(111)

plt.plot(x, y)
plt.xlim(-3, 3)
plt.ylim(-3, 3)

ax.set_aspect("equal", adjustable="box")

plt.xlabel("x")
plt.ylabel("sinx")

plt.show()
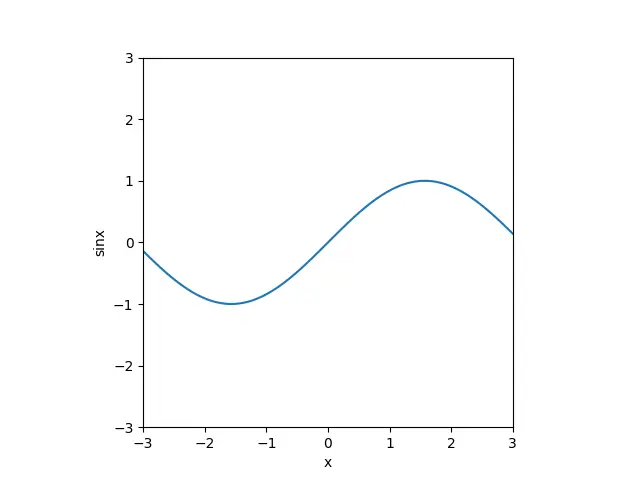
The above code uses NumPy and Matplotlib to create a plot of the sine function. It sets up an x-axis ranging from -3 to 3 and calculates corresponding y-values using the sine function.
The plot is configured to have equal aspect ratios, ensuring the units along both axes are of equal length. Labels for the x and y axes are added, and the plot is displayed. The above code essentially visualizes the sine function over a specified range with accurate aspect ratios.
This code sets both X-axis and Y-axis to have the same range. Then ax.set_aspect('equal') sets both axes to be equal.
plt.xlim(-3, 3)
plt.ylim(-3, 3)

ax.set_aspect("equal")
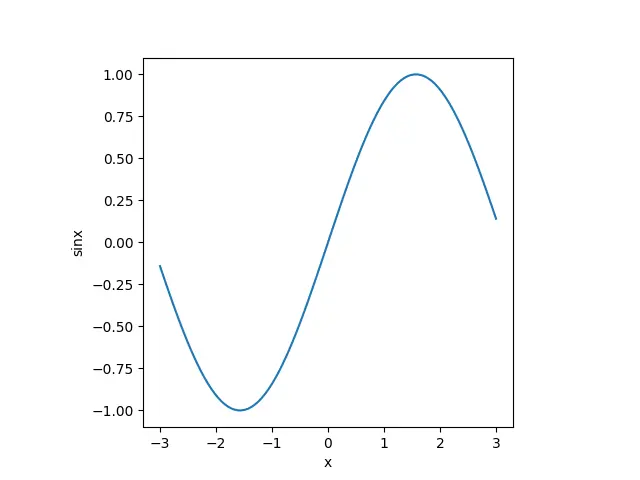
The above method only yields a square plot when ranges for both axes are set to be the same. To generate a square plot in the general case, we have to manually set the aspect ratio using the following:
axes.set_aspect(1.0 / axes.get_data_ratio())
axes.get_data_ratio() gets the ratio of the raw plot data. The value of its reciprocal is passed to set_aspect() to make axes equal without setting the limits of axes manually.
import numpy as np
import matplotlib.pyplot as plt

x = np.linspace(-3, 3, 100)
y = np.sin(x)

fig = plt.figure()
ax = fig.add_subplot(111)

plt.plot(x, y)

ax.set_aspect(1.0 / ax.get_data_ratio(), adjustable="box")

plt.xlabel("x")
plt.ylabel("sinx")
plt.show()
Use the axis() Method to Make a Square Plot With Equal Axes in Matplotlib
The matplotlib.pyplot.axis() method in Matplotlib is used to set or retrieve the current axis limits. It can be called with various options to control the appearance and behavior of the plot.
Syntax:
matplotlib.pyplot.axis(*args, **kwargs)
-
*args: This parameter can take several forms depending on the number of arguments provided:- If no arguments are provided, it returns the current axis limits as a tuple
(xmin, xmax, ymin, ymax). - If a single argument is provided, it can be one of the following:
'off': Turn off the axis lines and labels.'on': Turn on the axis lines and labels.'equal': Set equal scaling (i.e., one unit along each axis corresponds to the same physical distance).'scaled': Set equal scaling, but not necessarily the same physical distance along each axis.'tight': Set the axis limits to the data limits.('x', 'y', 'both', 'none'): Turn on/off the x-axis, y-axis, both, or neither.'square': Square plot; similar to'scaled', but initially forcingxmax-xmin == ymax-ymin.
- If two arguments are provided (e.g.,
axis([xmin, xmax, ymin, ymax])), it sets the axis limits explicitly. - If
*argsis a string of the form'xmin xmax ymin ymax', it sets the axis limits explicitly.
- If no arguments are provided, it returns the current axis limits as a tuple
-
**kwargs: Additional keyword arguments can be used to customize the appearance of the axis. For example,color='red'sets the axis color to red.
Use the axis('equal') Method to Make a Square Plot With Equal Axes
The simplest way to ensure equal axes in a Matplotlib plot is by using the axis('equal') method. This command sets the aspect ratio of the plot to be equal, resulting in a square plot.
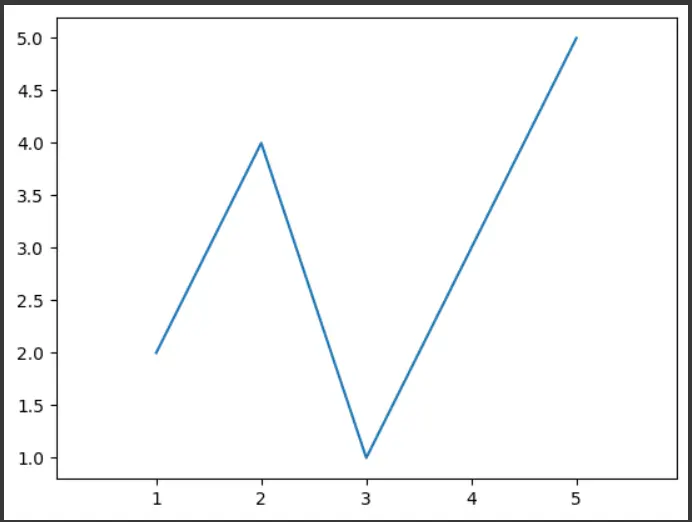
import matplotlib.pyplot as plt

# Data
x = [1, 2, 3, 4, 5]
y = [2, 4, 1, 3, 5]

# Create a plot
plt.plot(x, y)

# Set aspect ratio to be equal
plt.axis("equal")

# Show the plot
plt.show()
In this example, we first import the matplotlib.pyplot module, commonly aliased as plt. We then define example data x and y.
Next, we create a plot using plt.plot(x, y). The crucial step follows, where we use plt.axis('equal'). This command sets the aspect ratio of the plot to be equal, ensuring a square plot.
Finally, plt.show() is called to display the plot.
Use the axis('square') Method to Make a Square Plot With Equal Axes
If we pass 'square' as an argument to the axis() method, it creates a square plot where the ranges for both axes are equal to the length in the plot.
import numpy as np
import matplotlib.pyplot as plt

x = np.linspace(-3, 3, 100)
y = np.sin(x)
plt.plot(x, y)
plt.axis("square")
plt.xlabel("x")
plt.ylabel("sinx")
plt.show()
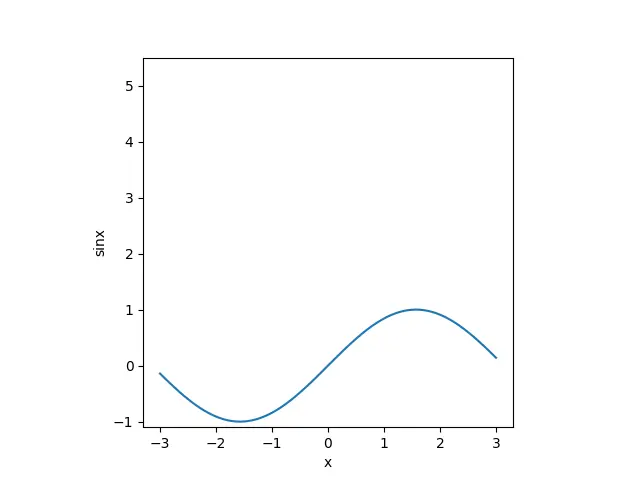
The above code uses NumPy and Matplotlib to plot the sine function. It sets up an x-axis ranging from -3 to 3 and calculates corresponding y-values using the sine function.
The plt.axis('square') command ensures that the aspect ratio of the plot is equal, resulting in a square plot. This means that the units along both axes are of equal length, providing an accurate representation of the data.
Labels for the x and y axes are added, and the plot is displayed. This code visualizes the sine function accurately.
ax.set_aspect('equal', adjustable='datalim'). The explicit axis limits set by the user are not respected.Conclusion
In conclusion, this article delves into the diverse methods available in Matplotlib to create square plots with equal axes. Achieving an equal aspect ratio is crucial for accurately representing data, as it ensures that units along both axes are of the same length.
The guide first introduces the use of set_aspect('equal') in Matplotlib, which directly sets the aspect ratio to create square plots. This method is simple and effective, particularly when both axes have the same range.
Additionally, the axis() method is explored as a versatile tool for setting or retrieving axis limits. When provided with options like 'equal' or 'square', it facilitates the creation of square plots with equal axes. This method grants more control over axis appearance and behavior.

Suraj Joshi is a backend software engineer at Matrice.ai.
LinkedIn