How to Automate Plot Updates in Matplotlib
To automate plot update in Matplotlib, we update the data, clear the existing plot, and then plot updated data in a loop. To clear the existing plots we use several methods such as canvas.draw() along with canvas_flush_events(), plt.draw() and clear_output().
canvas.draw() Along With canvas_flush_events()
We need to configure the plot once. Then, we could update the data of the plot objects with set_xdata() and set_ydata() and finally update the plot using canvas.draw().
import numpy as np
import time
import matplotlib.pyplot as plt
x = np.linspace(0, 10, 100)
y = np.cos(x)
plt.ion()
figure, ax = plt.subplots(figsize=(8, 6))
(line1,) = ax.plot(x, y)
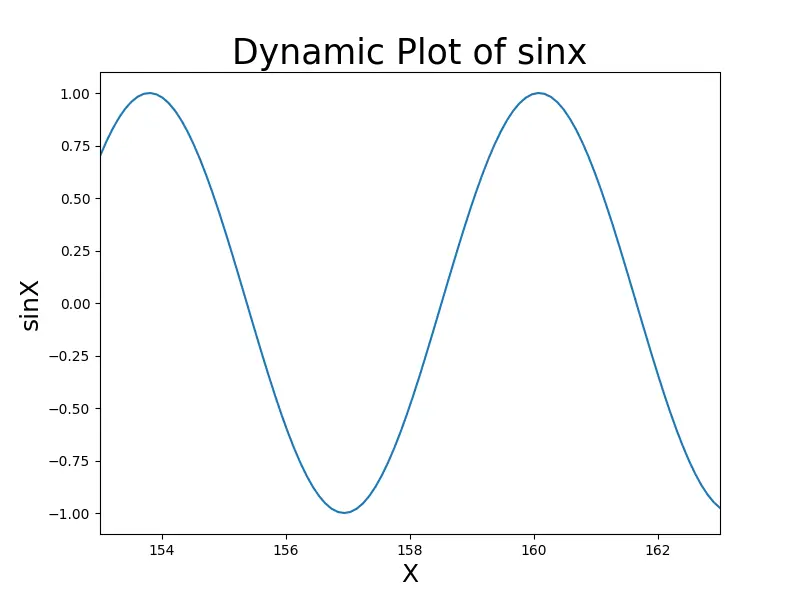
plt.title("Dynamic Plot of sinx", fontsize=25)
plt.xlabel("X", fontsize=18)
plt.ylabel("sinX", fontsize=18)
for p in range(100):
updated_y = np.cos(x - 0.05 * p)
line1.set_xdata(x)
line1.set_ydata(updated_y)
figure.canvas.draw()
figure.canvas.flush_events()
time.sleep(0.1)
plt.ion() turns on the interactive mode. The plot will not be updated if plt.ion() is not called.
canvas.draw() is a method based on JavaScript to display figures and canvas.flush_events() is also based on JavaScript to clear figures.
plt.draw() to Update Plots in Matplotlib
We use matplotlib.pyplot.draw() function to update altered figures that enables us to work in interactive mode. To update the plots, we need to clear existing figures for which we can use matplotlib.pyplot.clf() and matplotlib.axes.Axes.clear().
With plt.clf()
import numpy as np
import time
import matplotlib.pyplot as plt

x = np.linspace(0, 10, 100)
y = np.cos(x)

plt.ion()

figure, ax = plt.subplots(figsize=(8, 6))
(line1,) = ax.plot(x, y)

plt.title("Dynamic Plot of sinx", fontsize=25)

plt.xlabel("X", fontsize=18)
plt.ylabel("sinX", fontsize=18)

for p in range(100):
    updated_y = np.cos(x - 0.05 * p)

    line1.set_xdata(x)
    line1.set_ydata(updated_y)

    figure.canvas.draw()

    figure.canvas.flush_events()
    time.sleep(0.1)
Output:
With fig.clear()
import matplotlib.pyplot as plt
import numpy as np

x = np.linspace(0, 10, 100)
y = np.cos(x)

fig = plt.figure()

for p in range(50):
    p = 3
    updated_x = x + p
    updated_y = np.cos(x)
    plt.plot(updated_x, updated_y)
    plt.draw()
    x = updated_x
    y = updated_y
    plt.pause(0.2)
    fig.clear()
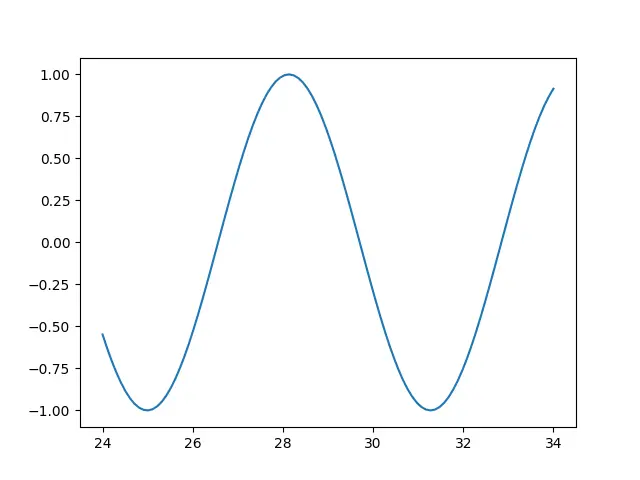
Output:


Suraj Joshi is a backend software engineer at Matrice.ai.
LinkedIn