Matplotlib でプロットの更新を自動化する方法
Suraj Joshi
2023年1月30日
Matplotlib
Matplotlib Dynamic Plotting
Matplotlib でプロットの更新を自動化するには、データを更新し、既存のプロットをクリアしてから、更新されたデータをループでプロットします。既存のプロットをクリアするには、canvas_draw()、canvas_flush_events()、plt.draw()、clear_output() などのいくつかのメソッドを使用します。
canvas.draw() と canvas_flush_events()
プロットを一度設定する必要があります。次に、set_xdata() と set_ydata() を使用してプロットオブジェクトのデータを更新し、最後に canvas.draw() を使用してプロットを更新します。
import numpy as np
import time
import matplotlib.pyplot as plt

x = np.linspace(0, 10, 100)
y = np.cos(x)

plt.ion()

figure, ax = plt.subplots(figsize=(8, 6))
(line1,) = ax.plot(x, y)

plt.title("Dynamic Plot of sinx", fontsize=25)

plt.xlabel("X", fontsize=18)
plt.ylabel("sinX", fontsize=18)

for p in range(100):
    updated_y = np.cos(x - 0.05 * p)

    line1.set_xdata(x)
    line1.set_ydata(updated_y)

    figure.canvas.draw()

    figure.canvas.flush_events()
    time.sleep(0.1)
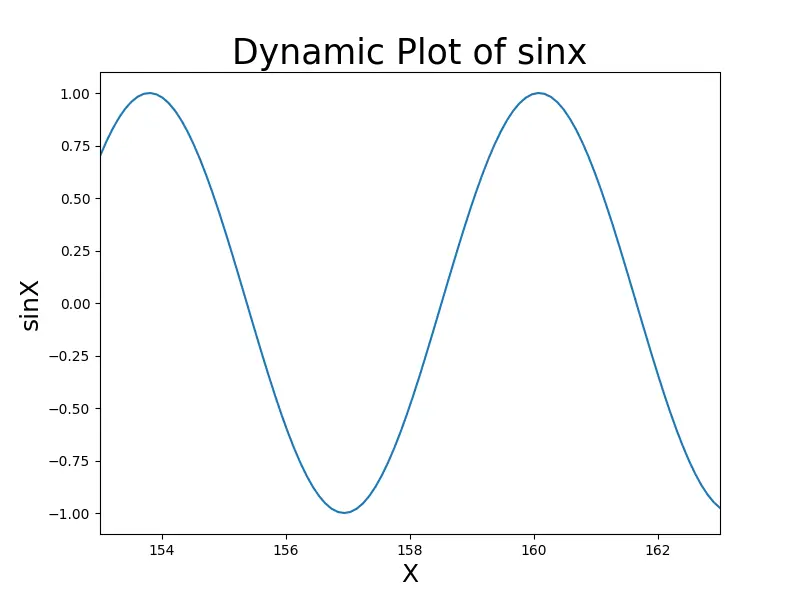
plt.ion() はインタラクティブモードをオンにします。呼び出されない場合、プロットは更新されません。
canvas.draw() は JavaScript に基づいて図を表示します。メソッドで、canvas.flush_events() も JavaScript に基づいて図をクリアします。
Matplotlib のプロットを更新するための plt.draw()
matplotlib.pyplot.draw() 関数を使用して、インタラクティブモードで作業できるように変更された図を更新します。プロットを更新するには、matplotlib.pyplot.clf() を使用できる既存の数値をクリアする必要があります。および matplotlib.axes.Axes.clear()。
plt.clf() を使用
import numpy as np
import time
import matplotlib.pyplot as plt

x = np.linspace(0, 10, 100)
y = np.cos(x)

plt.ion()

figure, ax = plt.subplots(figsize=(8, 6))
(line1,) = ax.plot(x, y)

plt.title("Dynamic Plot of sinx", fontsize=25)

plt.xlabel("X", fontsize=18)
plt.ylabel("sinX", fontsize=18)

for p in range(100):
    updated_y = np.cos(x - 0.05 * p)

    line1.set_xdata(x)
    line1.set_ydata(updated_y)

    figure.canvas.draw()

    figure.canvas.flush_events()
    time.sleep(0.1)
出力:
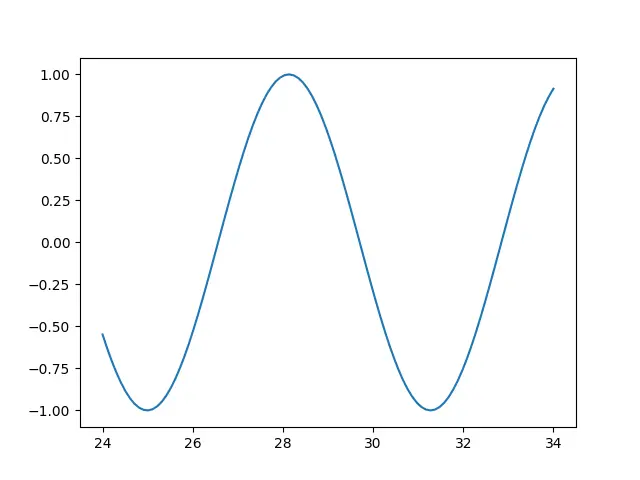
fig.clear() を使用
import matplotlib.pyplot as plt
import numpy as np

x = np.linspace(0, 10, 100)
y = np.cos(x)

fig = plt.figure()

for p in range(50):
    p = 3
    updated_x = x + p
    updated_y = np.cos(x)
    plt.plot(updated_x, updated_y)
    plt.draw()
    x = updated_x
    y = updated_y
    plt.pause(0.2)
    fig.clear()
出力:

チュートリアルを楽しんでいますか? <a href="https://www.youtube.com/@delftstack/?sub_confirmation=1" style="color: #a94442; font-weight: bold; text-decoration: underline;">DelftStackをチャンネル登録</a> して、高品質な動画ガイドをさらに制作するためのサポートをお願いします。 Subscribe
著者: Suraj Joshi

Suraj Joshi is a backend software engineer at Matrice.ai.
LinkedIn