如何在 Matplotlib 中自动执行图更新
Suraj Joshi
2024年2月15日
Matplotlib
Matplotlib Dynamic Plotting
为了在 Matplotlib 中自动执行图更新,我们将更新数据,清除现有图,然后在循环中绘制更新的数据。为了清除现有的绘图,我们使用了几种方法,例如 canvas.draw()和 canvas_flush_events(),plt.draw()和 clear_output()。
canvas.draw() 和 canvas_flush_events()
我们需要配置图形一次。然后,我们可以使用 set_xdata() 和 set_ydata() 更新绘图对象的数据,最后使用 canvas.draw() 更新绘图。
import numpy as np
import time
import matplotlib.pyplot as plt

x = np.linspace(0, 10, 100)
y = np.cos(x)

plt.ion()

figure, ax = plt.subplots(figsize=(8, 6))
(line1,) = ax.plot(x, y)

plt.title("Dynamic Plot of sinx", fontsize=25)

plt.xlabel("X", fontsize=18)
plt.ylabel("sinX", fontsize=18)

for p in range(100):
    updated_y = np.cos(x - 0.05 * p)

    line1.set_xdata(x)
    line1.set_ydata(updated_y)

    figure.canvas.draw()

    figure.canvas.flush_events()
    time.sleep(0.1)
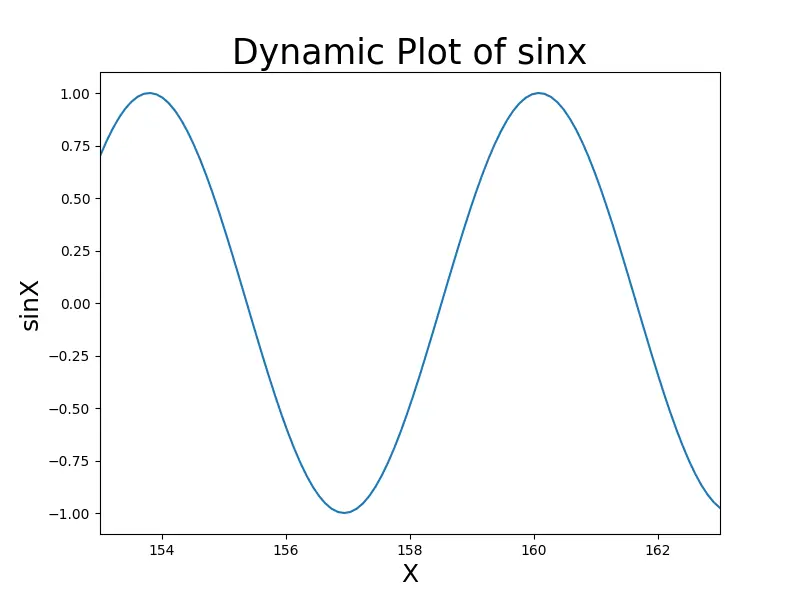
plt.ion() 打开交互模式。如果未调用,则该图不会更新。
canvas.draw() 是一种基于 JavaScript 来显示图形的方法,而 canvas.flush_events() 也基于 JavaScript 来清除图形。
plt.draw() 更新 Matplotlib 中的图
我们使用 matplotlib.pyplot.draw() 函数来更新已更改的图形,使我们能够以交互方式工作。要更新图,我们需要清除现有图形可以使用 matplotlib.pyplot.clf() 和 matplotlib.axes.Axes.clear()。
使用 plt.clf()
import numpy as np
import time
import matplotlib.pyplot as plt

x = np.linspace(0, 10, 100)
y = np.cos(x)

plt.ion()

figure, ax = plt.subplots(figsize=(8, 6))
(line1,) = ax.plot(x, y)

plt.title("Dynamic Plot of sinx", fontsize=25)

plt.xlabel("X", fontsize=18)
plt.ylabel("sinX", fontsize=18)

for p in range(100):
    updated_y = np.cos(x - 0.05 * p)

    line1.set_xdata(x)
    line1.set_ydata(updated_y)

    figure.canvas.draw()

    figure.canvas.flush_events()
    time.sleep(0.1)
输出:
使用 fig.clear()
import matplotlib.pyplot as plt
import numpy as np

x = np.linspace(0, 10, 100)
y = np.cos(x)

fig = plt.figure()

for p in range(50):
    p = 3
    updated_x = x + p
    updated_y = np.cos(x)
    plt.plot(updated_x, updated_y)
    plt.draw()
    x = updated_x
    y = updated_y
    plt.pause(0.2)
    fig.clear()
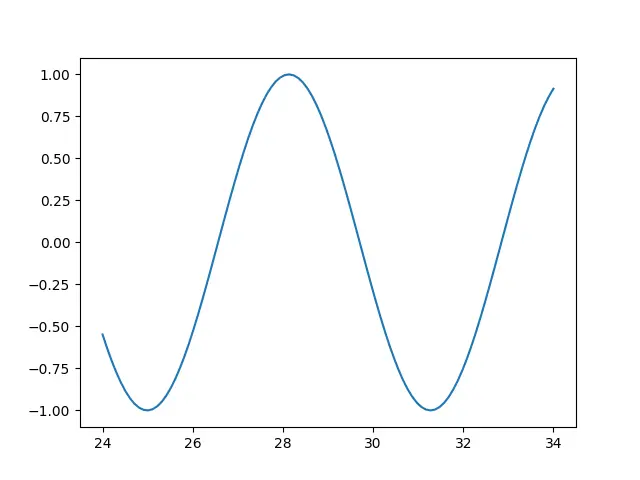
输出:

Enjoying our tutorials? Subscribe to DelftStack on YouTube to support us in creating more high-quality video guides. Subscribe
作者: Suraj Joshi

Suraj Joshi is a backend software engineer at Matrice.ai.
LinkedIn