SciPy stats.skew Function
-
the
scipy.stats.skewFunction -
Calculating Skewness Using
numpy.linspace() - Calculating Skewness Using Random Data
Skewness in statistics is defined as a measure of the symmetry of the distribution of some data. The point which is at the top of the whole distribution is known as the mode. The skewness is calculated by the following formula.
Skewness = 3(Mean - Median) / Standard Deviation
Conditions of skewness :
- If
skewness = 0, then data is normally distributed. - If
skewness > 0, then data is more weighed on the left side of the distribution. - If
skewness < 0, then data is more weighed on the right side of the distribution.
the scipy.stats.skew Function
The scipy.stats.skew function of the SciPy library is used to determine the value of skewness of a given data. This function is defined as scipy.stats.skew(a, axis, bias, nan_policy).
Following are the parameters of the scipy.stats.skew function.
a (ndarray) |
It defines the input array i.e, the input data. |
axis (int) |
It defines the axis along which the function computes the skewness value. The default value is 0 i.e, the function computes over the whole array. |
bais (bool) |
If the value of this parameter is set to False, then all the computations are corrected for the statistical bias. |
nan_policy |
It decides how to deal when there are NaN values in the input data. There are three decision parameters in the parameter, propagate, raise, omit. propagate simply returns the NaN value, raise returns an error and omit simply ignores the NaN values and the function continues with computation. These decision parameters are defined in single quotes ' '. Also, the default is set to propagate. |
All the parameters except the a (ndarray) parameter are optional. That means it is not necessary to define them every time while using the scipy.stats.skew function.
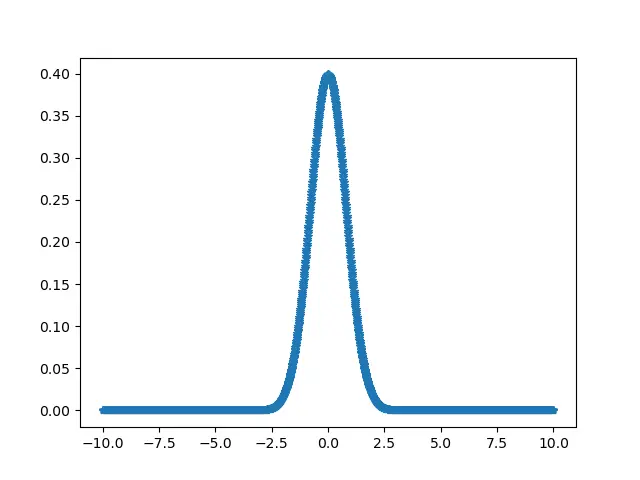
Calculating Skewness Using numpy.linspace()
The linespace() function of the NumPy library helps in creating random numerical sequences that are evenly spaced.
from scipy.stats import skew
import numpy as np
import pylab as p

x = np.linspace(-10, 10, 1000)
y = 1 / (np.sqrt(4 * np.pi)) * np.exp(-0.2 * (x) ** 2)

p.plot(x, y, ".")
p.show()

print("Skewness for the input data : ", skew(y))
Output:
Skewness for the input data : 1.458658437437705
Calculating Skewness Using Random Data
The np.random.normal function of the NumPy library is used in this method. This function helps create an array of a specified shape and size that consists of random values that are actually part of the gaussian distribution.
from scipy.stats import skew
import numpy as np

s = np.random.normal(0, 5, 10000)

print("S : ", s)

print("Skewness for input data : ", skew(s))
S :  [ 2.52232305  5.66398738  2.72036031 ...  0.53774684 -0.31164153
  1.99714612]
Skewness for input data :  0.0027004583356120505

Lakshay Kapoor is a final year B.Tech Computer Science student at Amity University Noida. He is familiar with programming languages and their real-world applications (Python/R/C++). Deeply interested in the area of Data Sciences and Machine Learning.
LinkedIn