SciPy scipy.stats.poisson
-
Syntax of
scipy.stats.poisson()to Generate Poisson Distribution -
Calculate
probability mass function (PMF)of Poisson Distribution Usingscipy.stats.poisson.pmf()Method -
Set
locValue inscipy.stats.poisson.pmf()Method -
Calculate
cumulative distribution function (CDF)of Poisson Distribution Usingscipy.stats.poisson.cdf()Method
The scipy.stats.poisson function generates a Poisson discrete random variable which can be used to calculate the probability mass function (PMF), probability density function (PDF), and cumulative distribution function (CDF) of any Poisson probability distribution.
Syntax of scipy.stats.poisson() to Generate Poisson Distribution
scipy.stats.poisson(pmf(mu, loc=0))
Parameters
mu |
average occurrence of an event in a specified interval of space or time |
loc |
By default, loc=0 represents the normal distribution, and the loc parameter specifies the shift in the distribution. |
Calculate probability mass function (PMF) of Poisson Distribution Using scipy.stats.poisson.pmf() Method
import numpy as np
import matplotlib.pyplot as plt
from scipy import stats

x = np.arange(0, 20, 0.1)
y = stats.poisson.pmf(x, mu=10)

plt.plot(x, y)
plt.title("Poisson distribution with mu=10 and loc=0")
plt.xlabel("Random variable")
plt.ylabel("Probability")
plt.show()
Output:
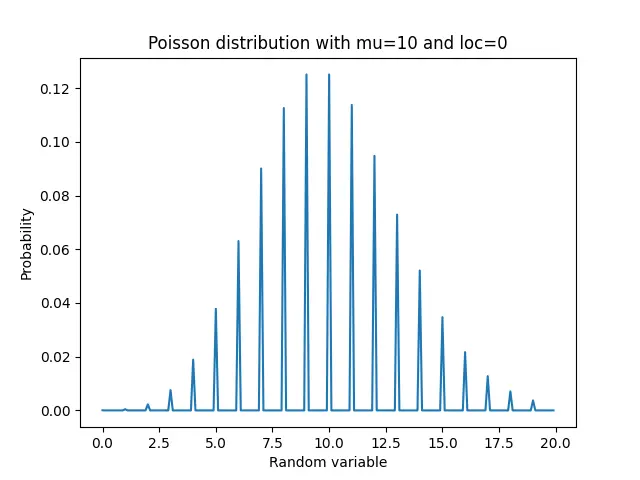
Here, we take a NumPy array of random variables from 0 to 20 with a spacing of 0.1 between two adjacent values. We then calculate the probability mass function PMF values for each value in the NumPy array for a Poisson distribution with mu=10.
Next, we plot the PMF values against random variable values. By default, the value of loc is set to 0, which makes the random variable with the highest PMF equal to mu, and hence the graph peaks at mu.
Set loc Value in scipy.stats.poisson.pmf() Method
By default, the value of loc in scipy.stats.poisson.pmf() is equal to 0 which gives the normal distribution. To shift the distribution, we the value of loc parameter in the scipy.stats.poisson.pmf() method to desired value.
import numpy as np
import matplotlib.pyplot as plt
from scipy import stats

x = np.arange(0, 20, 0.1)
y = stats.poisson.pmf(x, mu=10, loc=5)

plt.plot(x, y)
plt.title("Poisson distribution with mu=10 and loc=5")
plt.xlabel("Random variable")
plt.ylabel("Probability")
plt.show()
Output:
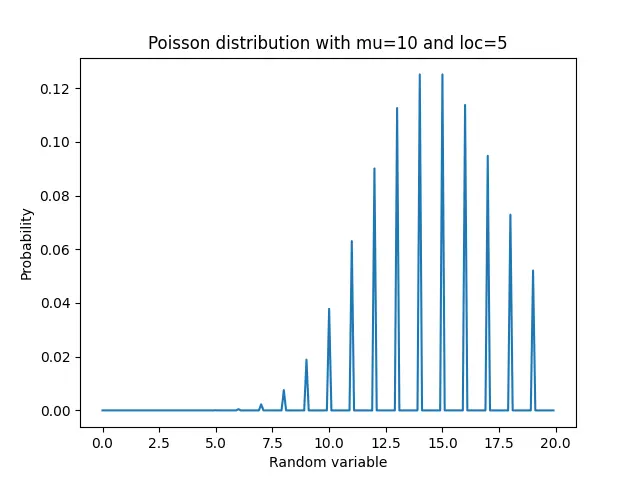
It generates a plot of random variables from 0 to 20 with a spacing of 0.1 and corresponding Probability Mass Function(PMF) values for a Poisson distribution with mu=10 and loc=5. As the loc is set to 5, the peak of the plot will shift towards the right by 5 units.
Calculate cumulative distribution function (CDF) of Poisson Distribution Using scipy.stats.poisson.cdf() Method
The scipy.stats.poisson.cdf() method calculates cumulative distribution function(CDF) value of a random variable for a given Poisson distribution. The CDF of a random variable represents cumulative probabilities of all the values equal to or less than the random variable.
import numpy as np
import matplotlib.pyplot as plt
from scipy import stats

x = np.arange(0, 20, 0.1)
y = stats.poisson.cdf(x, mu=10)

plt.plot(x, y)
plt.title("CDF of Poisson distribution with mu=10")
plt.xlabel("Random variable")
plt.ylabel("Cumulative Probability")
plt.show()
Output:
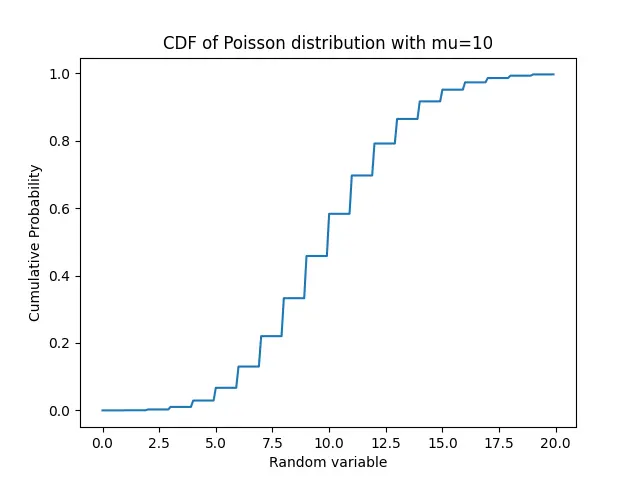
Here, we take a NumPy array of random variables from 0 to 20 with a spacing of 0.1 between two adjacent values. We then calculate the cumulative distribution function(CDF) values for each value in the NumPy array for a Poisson distribution with mu=10.
Next, we plot the CDF values against random variable values.
As the cumulative probability increases as we move towards the right due to new values, the CDF curve has an increasing nature, as seen in the figure above.