SciPy scipy.stats.linregress Method
-
Syntax of
scipy.stats.linregress()Method of SciPy in Python -
Find a Regression Line for a Given Set of Points Using the
scipy.stats.linregressMethod of SciPy in Python -
Find a Regression Line for a Given Set of Points Using
scipy.stats.linregressMethod Withy=None

Python Scipy scipy.stats.linregress method is used to calculate the parameters that establish a linear relationship between two sets of variables using the least-squares method.
The regression equation we are trying to find using the scipy.stats.linregress method can determine the value of one set of the variable given the values for the other variable set.
Syntax of scipy.stats.linregress() Method of SciPy in Python
scipy.stats.linregress(x, y=None, alternative="two-sided")
Parameters:
x |
Array-like. It is the input set of values provided to the method. |
y |
Array-like with the same length as x. If y=None, array x is split along the 2nd dimension, and the second set is treated as y. |
alternative |
An optional parameter can take any value from the options: two-sided, less, and greater. |
The method returns an object of the LinregressResult class having with slope, intercept, rvalue, pvalue, stderr, and intercept_stderr.
Find a Regression Line for a Given Set of Points Using the scipy.stats.linregress Method of SciPy in Python
The scipy.stats.linregress method can be used to find a linear relationship between two sets of given points.
For simplicity, we will try to fit a line to two sets of data points, x and y, where x and y are one-dimensional.
import numpy as np
import matplotlib.pyplot as plt
from scipy.stats import linregress

# create some random data
x = np.linspace(-3, 5, 11)

m = 3
c = -4
y = m * x + c

# add some noise to data
y_len = y.shape[0]
noise = np.random.rand(y_len) * 5
y = y + noise

result = linregress(x, y)
slope = result.slope
intercept = result.intercept
y_hat = slope * x + intercept

plt.scatter(x, y, color="green")
plt.plot(x, y_hat, color="red")
plt.xlabel("X")
plt.ylabel("Y")
plt.title("Linear Regression")
plt.show()
Output:
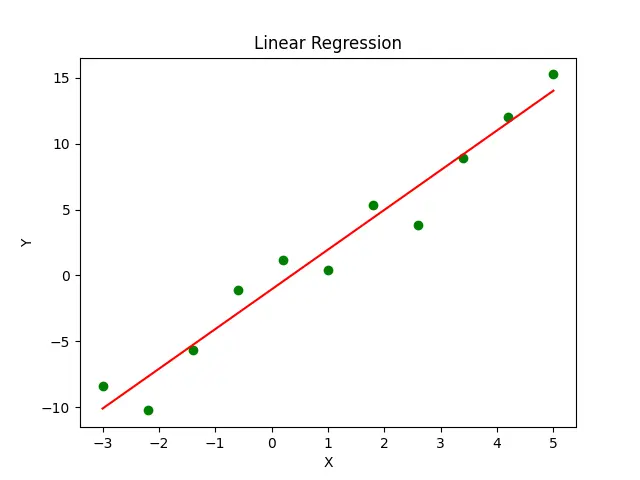
Here, we generate a sample dataset consisting of two one-dimensional arrays, x and y, with the same length where x and y are related as y = 3*x-4.
Then we add some noise to the dataset to look more realistic as we do not have a perfect linear relationship between two sets of variables in most cases.
We then pass the arrays x and y into the linregress() method and get the result object as an output from the method.
The slope and intercept of the line fitted to the data points can be accessed through the slope and intercept parameters of the result object, respectively.
The green points in the output graph represent the actual points, and the red line represents the regression line fitted to the data points.
Find a Regression Line for a Given Set of Points Using scipy.stats.linregress Method With y=None
We may have two different sets of points represented by a single array in some cases. We can pass only the array variable into the linregress method in such cases.
It will split the input array along the 2nd dimension, and the second set resulting after splitting will be treated as the second set.
import numpy as np
import matplotlib.pyplot as plt
from scipy.stats import linregress

x = np.array(
    [
        [-3.0, -2.2, -1.4, -0.6, 0.2, 1.0, 1.8, 2.6, 3.4, 4.2, 5.0],
        [-10.77, -10.12, -5.90, -4.8, -0.61, 2.67, 3.34, 6.25, 11.16, 12.12, 12.19],
    ]
)


result = linregress(x)
slope = result.slope
intercept = result.intercept
y_hat = slope * x[0] + intercept

plt.scatter(x[0], x[1], color="green")
plt.plot(x[0], y_hat, color="red")
plt.xlabel("x [0]")
plt.ylabel("x [1]")
plt.title("Linear Regression")
plt.show()
Output:
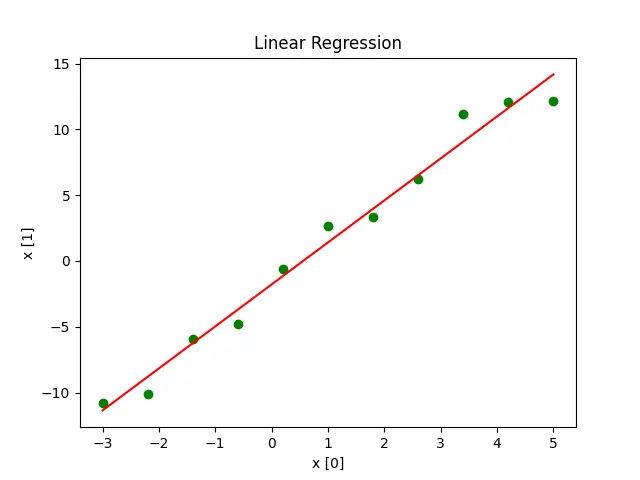
In the example above, y = None(default value). So, the input array is split as x[0] and x[1], and the linregress method fits the regression line between x[0] and x[1].
The green points in the output graph represent the actual points represented by (x[0],x[1]), and the red line represents the regression line fitted to the data points.

Suraj Joshi is a backend software engineer at Matrice.ai.
LinkedIn