SciPy scipy.stats.binom Function
-
Syntax of
scipy.stats.binom()to Calculate Binomial Distribution: -
Example Codes : Calculating probability mass function(pmf) of Discrete Distribution Using
binom - Additional Code
-
Example Codes :
Calculating cumulative distribution function(cdf)Usingbinom -
Example Codes : Calculating mean, variance, skewness, kurtosis of Distribution Using
binom

Python Scipy scipy.stats.binom() function calculates the binomial distribution of an experiment that has two possible outcomes success or failure. Furthermore, we can apply binom() method to separately obtain probability mass function(pmf), probability density function(pdf), cumulative distribution function(cdf), stats, and so forth of any binomial distribution.
Syntax of scipy.stats.binom() to Calculate Binomial Distribution:
scipy.stats.binom(n, p)
Parameters
n |
It is the number of trials an experiment is performed. |
p |
It is the probability of success on one trial. The other possible outcome is failure, denoted by q and equal to 1-p. |
Example Codes : Calculating probability mass function(pmf) of Discrete Distribution Using binom
import scipy
from scipy import stats
from scipy.stats import binom

n = 12
p = 0.8
x = range(0, n)
pmf_result = binom.pmf(x, n, p)

print("x:\n", list(x))
print("The pmf of x is:\n", pmf_result)
Output:
x:
 [0, 1, 2, 3, 4, 5, 6, 7, 8, 9, 10, 11]
The pmf of x is:
 [4.09600000e-09 1.96608000e-07 4.32537600e-06 5.76716800e-05
 5.19045120e-04 3.32188877e-03 1.55021476e-02 5.31502203e-02
 1.32875551e-01 2.36223201e-01 2.83467842e-01 2.06158430e-01]
If we try to visualize the above output into a bar graph, it will look like this:
Additional Code
import scipy
from scipy import stats
from scipy.stats import binom
import matplotlib.pyplot as plt

n = 12
p = 0.8
x = range(0, n)
pmf_result = binom.pmf(x, n, p)

dist = [binom.pmf(r, n, p) for r in x]
plt.bar(x, dist)
plt.xlabel("Number of Success")
plt.ylabel("Probability ")
plt.show()
Output:
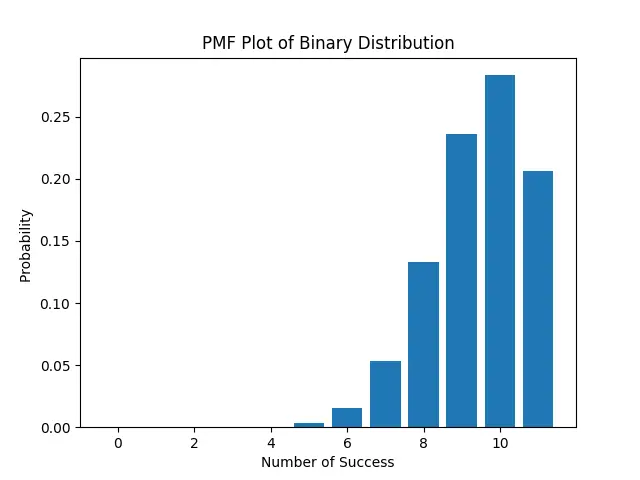
Here, an experiment that has 80 percent success probability is taken into consideration, and the experiment is performed 12 times. Since our probability of success on each trial is fairly high, so the output can be visualized as :
- The chance of getting success only once will be very less
4.09600000e-09. - The chance of getting success nearly 8 times is fairly high, as shown in the bar graph.
Example Codes : Calculating cumulative distribution function(cdf) Using binom
We use the cdf() function to calculate the probability of getting a number of successes within a certain range.
import scipy
from scipy import stats
from scipy.stats import binom

n = 10
p = 0.8
k = 5
cdf_result = binom.cdf(k, n, p)

print("The cdf of k=5 is in given binomial distribution is: ", cdf_result)
Output:
The cdf of k=5 is in given binomial distribution is: 0.032793497599999964
Here, we are trying to know the success rate when 10 repeated trials are performed where the success probability is 80 percent.
And our output 0.03279349759999386 shows the chances of getting 5 successes or less in 10 trials is nearly 3 percent.
Example Codes : Calculating mean, variance, skewness, kurtosis of Distribution Using binom
import scipy
from scipy import stats
from scipy.stats import binom

n = 12
p = 0.8
mean, variance, skewness, kurtosis = binom.stats(n, p, moments="mvsk")

print("The mean of the given distribution is:", mean)
print("The variance of the given distribution is:", variance)
print("The skewness of the given distribution is:", skewness)
print("The kurtosis of the given distribution is:", kurtosis)
Output:
The mean of given distribution is: 9.600000000000001
The variance of given distribution is: 1.92
The skewness of given distribution is: -0.4330127018922194
The kurtosis of given distribution is: 0.020833333333333353
Here, the negative skewness means that the tail of the left side of distribution is fatter or longer than the right side.