SciPy stats.kurtosis Function

Kurtosis in statistics helps to find out the difference between the heaviness of the tails of a particular distribution and the heaviness of the tails of a normal distribution of a given data. So, this statistical measure helps identify if the tails of a particular distribution consist of extreme value.
Along with this statistical measure, there is one more metric known as excess kurtosis. This measure helps in comparing the kurtosis of a particular distribution with the kurtosis of a normal distribution. Excess kurtosis can be calculated as below.
Excess Kurtosis = Kurtosis - 3
There are three types of kurtosis. The type of kurtosis is defined by the excess kurtosis of a specific distribution.
- Mesokurtic - If a given data represents a mesokurtic distribution, it shows an excess kurtosis that is zero or close to zero. In other words, a given data follows a mesokurtic distribution if it shows a normal distribution.
- Leptokurtic - Leptokurtic shows a positive excess kurtosis. The leptokurtic distribution represents very heavy tails on both sides, which denotes some values at an uncommon distance from other values in the data, also known as
outliers. - Platykurtic - Platykurtic distribution represents a negative excess kurtosis. The kurtosis shows a distribution that has flat tails. Flat tails in a distribution indicate that there are small outliers present.
the scipy.stats.kurtosis Function
The scipy.stats.kurtosis function of the SciPy library helps in calculating the kurtosis of a given dataset.
Syntax
scipy.stats.kurtosis(a, axis=0, fisher=True, bias=True, nan_policy="raise")
Parameters
a (array) |
It defines the input data for which the kurtosis is calculated. | |
axis (int) |
It defines the axis along which the kurtosis of the input data is calculated. The default value of this parameter is 0. If the value is None, then the function simply computes over the whole input data. |
|
fisher (bool) |
A boolean parameter. If the value of this parameter is True, then Fisher’s definition i.e normal ==> 0.0 is used. And if the value of the parameter is False, then Pearson’s definition i.e normal ==> 3.0 is used. |
|
bias (bool) |
This is also a boolean parameter. If the value of this parameter is False, then all the calculations are corrected for the statistical bias. |
|
nan_policy |
This parameter decides how to deal when there are NaN values in the input data. There are three decision parameters in the parameter, propagate, raise, omit. propagate simply returns the NaN value, raise returns an error and omit simply ignores the NaN values and the function continues with computation. These decision parameters are defined in single quotes ''. The default value of this parameter is propagate. |
Example of Kurtosis
from scipy.stats import kurtosis
import numpy as np
import pylab as p

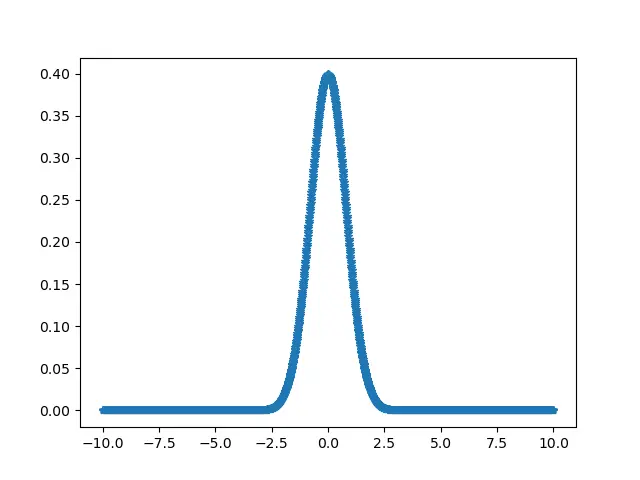
a = np.linspace(-10, 10, 2000)
b = 1 / (np.sqrt(2 * np.pi)) * np.exp(-0.5 * (a) ** 2)

p.plot(a, b, ".")

print("Kurtosis value for the given normal distribution :", kurtosis(b))

print("Kurtosis value for the given normal distribution :", kurtosis(b, fisher=False))

print(
    "Kurtosis value for the given normal distribution :",
    kurtosis(b, fisher=True, bias=False),
)
Output:

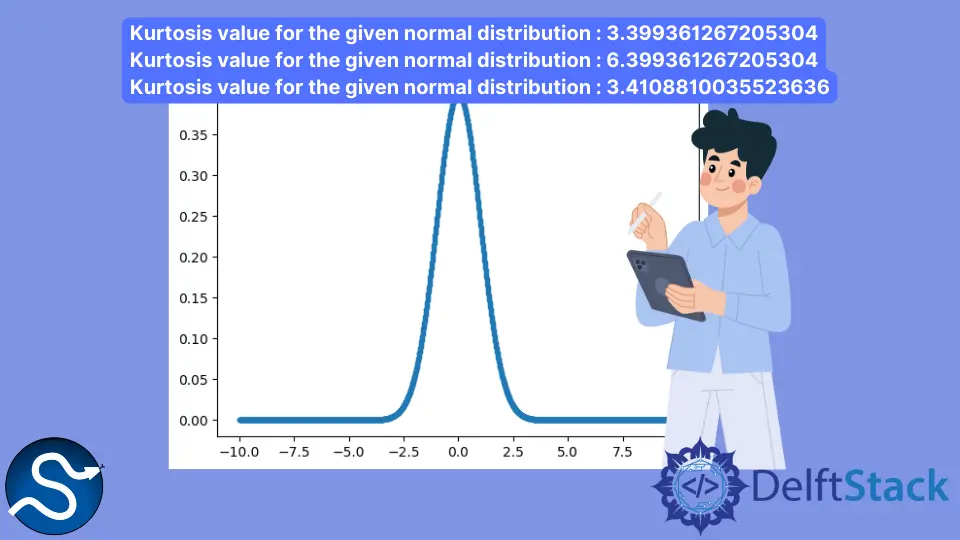
Kurtosis value for the given normal distribution : 3.399361267205304
Kurtosis value for the given normal distribution : 6.399361267205304
Kurtosis value for the given normal distribution : 3.4108810035523636
Lakshay Kapoor is a final year B.Tech Computer Science student at Amity University Noida. He is familiar with programming languages and their real-world applications (Python/R/C++). Deeply interested in the area of Data Sciences and Machine Learning.
LinkedIn