The scale_colour_discrete Function in R
-
Use
scale_colour_discreteto ModifycolourScale Labels in R -
Use
scale_colour_discreteto ModifycolourScale Name in R
This article will introduce how to use scale_colour_discrete in R.
Use scale_colour_discrete to Modify colour Scale Labels in R
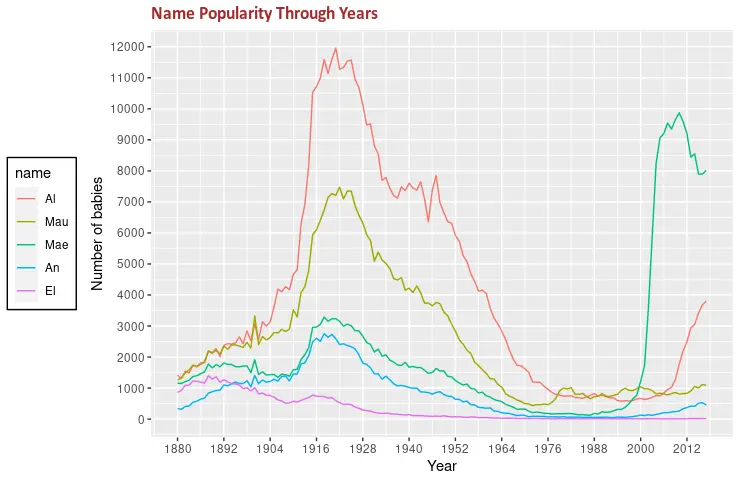
scale_colour_discrete can be used to modify colour scale labels which generally need to have discrete values. In this case, we demonstrate an example using the filtered babynames dataset, from which only five names are extracted to make it more simple. We draw a line plot using geom_line. Mapped variables on the x/y-axis are the number of babies and the years they are born in. Since the names are mapped to the colour scale, they will have a legend where different colors are mapped to each of them. Using the labels parameter of the scale_colour_discrete function, we can pass a vector of values by which we can substitute the existing scale labels.
library(ggplot2)
library(gridExtra)
library(babynames)
library(dplyr)

dat <- babynames %>%
  filter(name %in% c("Alice", "Maude", "Mae",
                     "Annie", "Ella")) %>% filter(sex=="F")

p3 <- ggplot(dat, aes(x = year, y = n, colour = name)) +
  geom_line() +
  scale_colour_discrete(
    labels = c("Al", "Mau", "Mae", "An", "El")) +
  scale_y_continuous(
    breaks = seq(0, 13000, 1000),
    name = "Number of babies") +
  scale_x_continuous(
    breaks = seq(1880, 2017, 12),
    name = "Year") +
  theme(
    legend.position = "left",
    legend.background = element_rect(fill = "white", colour = "black"),
    plot.title = element_text(
      size = rel(1.2), lineheight = .9,
      family = "Calibri", face = "bold", colour = "brown"
    )) +
  ggtitle("Name Popularity Through Years")

p3
Use scale_colour_discrete to Modify colour Scale Name in R
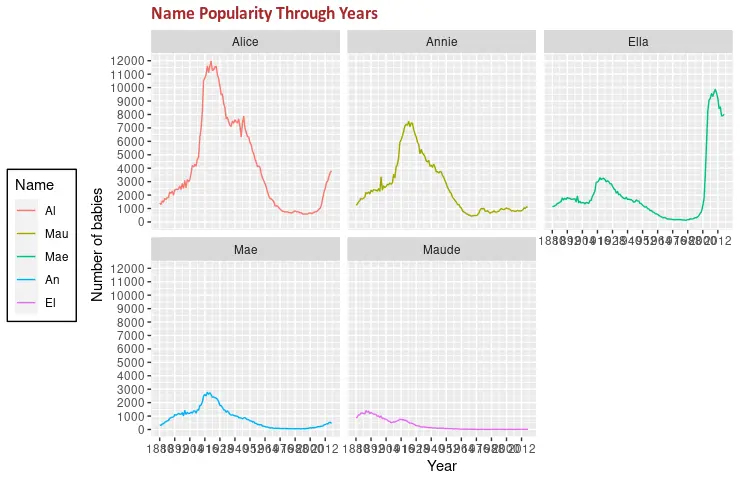
Another useful parameter of the scale_colour_discrete function is name, which controls the colour scale title. The custom string value can be assigned to the name argument, which results in a modified legend name in the following example code.
library(ggplot2)
library(gridExtra)
library(babynames)
library(dplyr)

dat <- babynames %>%
  filter(name %in% c("Alice", "Maude", "Mae",
                     "Annie", "Ella")) %>% filter(sex=="F")

p3 <- ggplot(dat, aes(x = year, y = n, colour = name)) +
  geom_line() +
  scale_colour_discrete(
    name = "Name",
    labels = c("Al", "Mau", "Mae", "An", "El")) +
  scale_y_continuous(
    breaks = seq(0, 13000, 1000),
    name = "Number of babies") +
  scale_x_continuous(
    breaks = seq(1880, 2017, 12),
    name = "Year") +
  theme(
    legend.position = "left",
    legend.background = element_rect(fill = "white", colour = "black"),
    plot.title = element_text(
      size = rel(1.2), lineheight = .9,
      family = "Calibri", face = "bold", colour = "brown"
    )) +
  ggtitle("Name Popularity Through Years")


p3

The previous plot draws all lines on a single panel, but we can output each line on a separate one using the facet_wrap function. facet_wrap takes the variables that need to be mapped as the first argument.
library(ggplot2)
library(gridExtra)
library(babynames)
library(dplyr)

dat <- babynames %>%
  filter(name %in% c("Alice", "Maude", "Mae",
                     "Annie", "Ella")) %>% filter(sex=="F")

p4 <- ggplot(dat, aes(x = year, y = n, colour = name)) +
  geom_line() +
  scale_colour_discrete(
    name = "Name",
    labels = c("Al", "Mau", "Mae", "An", "El")) +
  scale_y_continuous(
    breaks = seq(0, 13000, 1000),
    name = "Number of babies") +
  scale_x_continuous(
    breaks = seq(1880, 2017, 12),
    name = "Year") +
  theme(
    legend.position = "left",
    legend.background = element_rect(fill = "white", colour = "black"),
    plot.title = element_text(
      size = rel(1.2), lineheight = .9,
      family = "Calibri", face = "bold", colour = "brown"
    )) +
  ggtitle("Name Popularity Through Years") +
  facet_wrap(vars(name))

p4

Founder of DelftStack.com. Jinku has worked in the robotics and automotive industries for over 8 years. He sharpened his coding skills when he needed to do the automatic testing, data collection from remote servers and report creation from the endurance test. He is from an electrical/electronics engineering background but has expanded his interest to embedded electronics, embedded programming and front-/back-end programming.
LinkedIn Facebook