R でグループ化された箱ひげ図を作成する
この記事では、R でグループ化された箱ひげ図を作成する方法に関する複数の方法を示します。
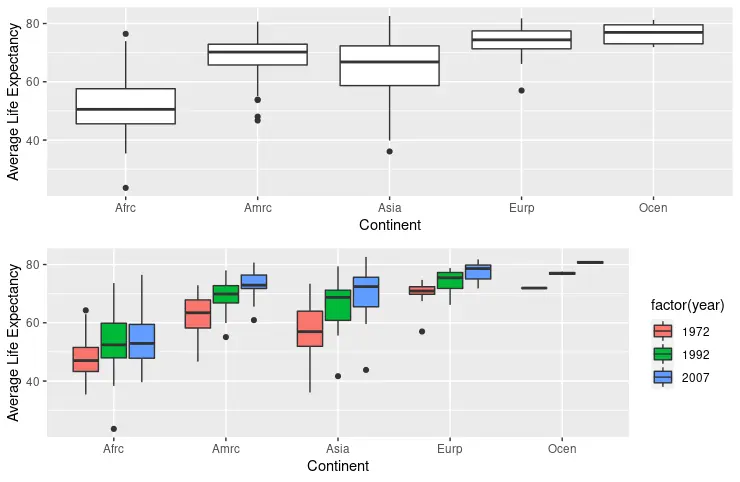
R で ggplot 関数の fill パラメーターを使用してグループ化された箱ひげ図を作成する
ggplot 関数と geom_boxplot は、通常、箱ひげ図オブジェクトを作成するために使用されます。ggplot 関数の最初のパラメーターは使用されるデータセットを表し、2 番目のパラメーターは美的マッピングのリストを指定します。aes 関数は、x および y 引数を gapminder データセットの continent および lifeExp 列にマップし、最初に dplyr パッケージ関数を使用してフィルタリングします。次に、fill パラメーターは year 列データをマップし、各大陸の毎年の箱ひげ図を描画します。year データは、fill パラメータに割り当てる前に係数に変換する必要があります。それ以外の場合、描画されたプロットはグループ化に影響しません。
library(ggplot2)
library(gridExtra)
library(gapminder)
library(dplyr)

dat <- gapminder %>%
  filter(year %in% c(1972, 1992, 2007))

p1 <- ggplot(dat, aes(x = continent, y = lifeExp, fill = year)) +
  geom_boxplot() +
  scale_y_continuous(name = "Average Life Expectancy") +
  scale_x_discrete(labels = abbreviate, name = "Continent")

p2 <- ggplot(dat, aes(x = continent, y = lifeExp, fill = factor(year))) +
  geom_boxplot() +
  scale_y_continuous(name = "Average Life Expectancy") +
  scale_x_discrete(labels = abbreviate, name = "Continent")

grid.arrange(p1, p2, nrow = 2)
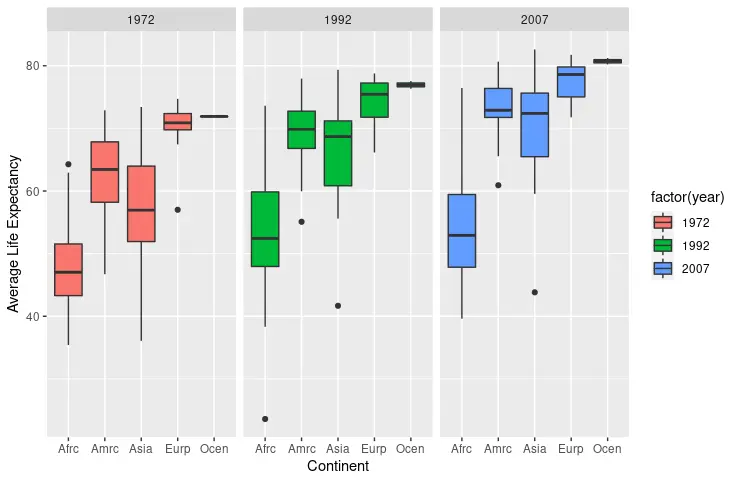
R で facet_wrap 関数を使用してグループ化された箱ひげ図を作成する
facet_wrap 関数は、特定のパラメーターでグループ化された複数の箱ひげ図を描画するためのもう 1つのオプションです。この場合、プロットの年次グループ化を示します。facet_wrap は fill パラメーターを指定しなくても機能しますが、次のコードスニペットを使用して出力されるように、色によって異なるプロットを区別するのに役立ちます。scale_x_discrete と scale_y_continuous は、ラベルと軸名を変更するためにも使用されます。
library(ggplot2)
library(gridExtra)
library(gapminder)
library(dplyr)

dat <- gapminder %>%
  filter(year %in% c(1972, 1992, 2007))

p3 <- ggplot(dat, aes(x = continent, y = lifeExp, fill = factor(year))) +
  geom_boxplot() +
  facet_wrap(~year) +
  scale_y_continuous(name = "Average Life Expectancy") +
  scale_x_discrete(labels = abbreviate, name = "Continent")

p3
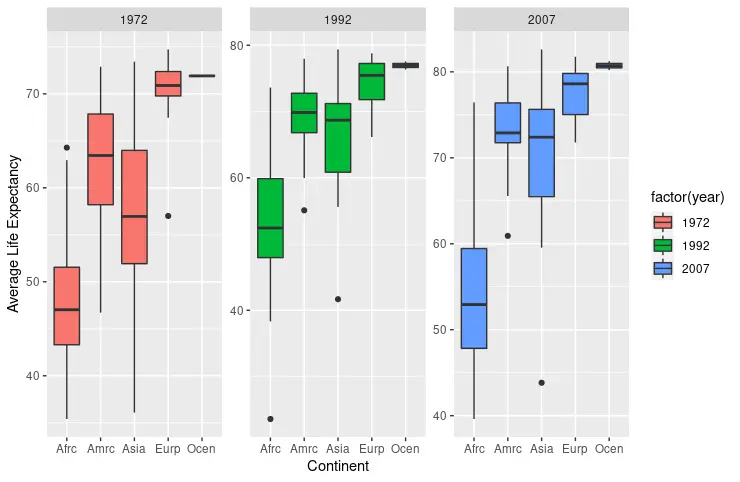
facet_wrap は、異なるプロットに同じスケールを表示します。free 文字列を scale パラメータに割り当てることはできますが、その結果、スケールが自動的に調整されます。
library(ggplot2)
library(gridExtra)
library(gapminder)
library(dplyr)

dat <- gapminder %>%
  filter(year %in% c(1972, 1992, 2007))

p4 <- ggplot(dat, aes(x = continent, y = lifeExp, fill = factor(year))) +
  geom_boxplot() +
  facet_wrap(~year, scale = "free") +
  scale_y_continuous(name = "Average Life Expectancy") +
  scale_x_discrete(labels = abbreviate, name = "Continent")

p4
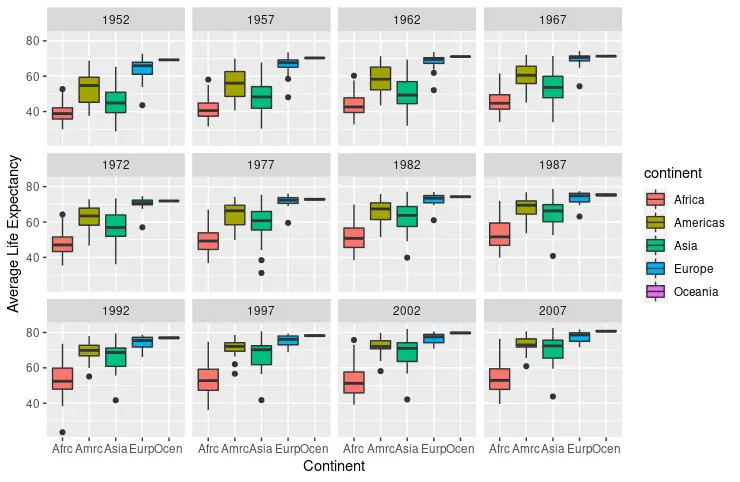
フィルタリングされていない gapminder データセットから毎年箱ひげ図を作成することもできます。今回は、fill パラメーターに continent 列がマップされ、facet_wrap 関数は year データを再度取得します。
library(ggplot2)
library(gridExtra)
library(gapminder)
library(dplyr)

p5 <- ggplot(gapminder, aes(x = continent, y = lifeExp, fill = continent)) +
  facet_wrap(~year) +
  geom_boxplot() +
  scale_y_continuous(name = "Average Life Expectancy") +
  scale_x_discrete(labels = abbreviate, name = "Continent")

p5