How to Set the Legend Outside of the Figure in Seaborn

This article is all about the legend of a figure in Seaborn. We will share several different tips, such as putting the legend outside the figure and making a horizontal legend in Seaborn.
Set the Legend Outside the Figure Using the bbox_to_anchor Argument in Seaborn
When adding a legend to your Matplotlib figures, the location of that legend is super important. Matplotlib will try to auto-detect the best location for your legend, but we can also move it around the plot, and especially sometimes, we might want to move the legend outside of the figure altogether.
Since there is no way to handle the legend using Seaborn, we will need Matplotlib to solve this problem. Let’s see how we can use these libraries together.
Let’s start importing some libraries and creating two arrays for the x and y axes. We also create two line plots using Seaborn’s lineplot() method.
Code:
import seaborn as sb
import numpy as np
import matplotlib.pyplot as plot
sb.set_style("whitegrid")
X1 = np.array([1, 2, 3, 4, 5])
Y1 = np.array([2, 1, 4, 6, 4])
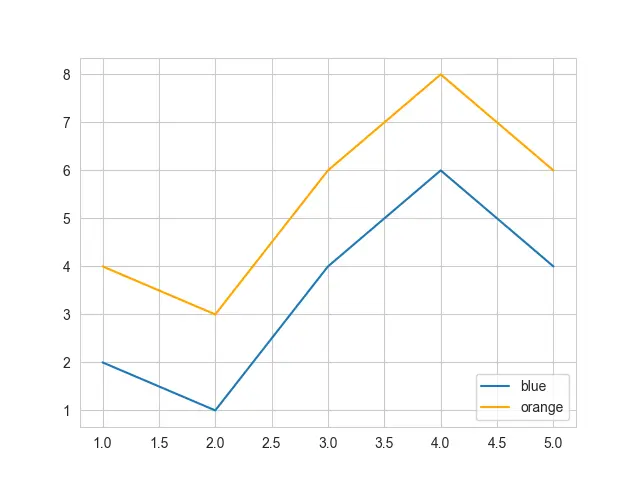
sb.lineplot(X1, Y1, label="blue")
sb.lineplot(X1, Y1 + 2, color="orange", label="orange")
plot.legend(loc="lower right")
plot.show()
There is an argument called loc within the legend function. This can accept a string such as lower right, which means you would like to put the legend in the lower right corner.
Output:
There is another thing about how we can move that legend completely outside the figure. There are many different ways to do this, but we will show you the easiest way.
To move the legend outside, we will pass an argument called bbox_to_anchor. This argument accepts a tuple ranging from 0 to 1 for the x and y dimensions.
Code:
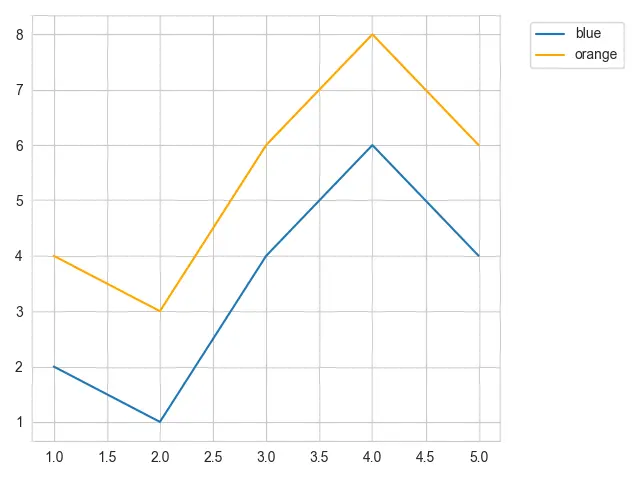
plot.legend(bbox_to_anchor=(1.05, 1), loc="upper left")
So if we pass 1.05 and 1, that will move the legend to the upper right corner. If you are going to use this bbox_to_anchor approach, you should use the loc argument to represent which corner of our legend should be aligned.
Code:
import seaborn as sb
import numpy as np
import matplotlib.pyplot as plot

sb.set_style("whitegrid")

X1 = np.array([1, 2, 3, 4, 5])
Y1 = np.array([2, 1, 4, 6, 4])

sb.lineplot(X1, Y1, label="blue")
sb.lineplot(X1, Y1 + 2, color="orange", label="orange")

plot.legend(bbox_to_anchor=(1.05, 1), loc="upper left")
plot.tight_layout()
plot.show()
We have passed the upper left, which means the upper left corner of the legend will be in spots 1.05 and 1.
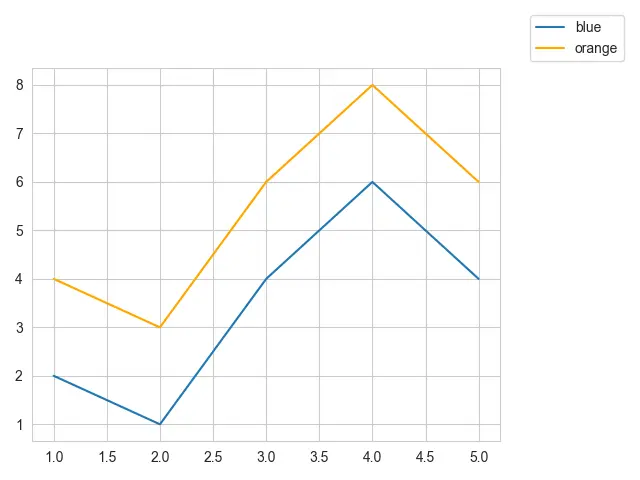
If we change the location, let’s say lower left, we will see the bottom left corner is aligned in that position.
import seaborn as sb
import numpy as np
import matplotlib.pyplot as plot

sb.set_style("whitegrid")

X1 = np.array([1, 2, 3, 4, 5])
Y1 = np.array([2, 1, 4, 6, 4])

sb.lineplot(X1, Y1, label="blue")
sb.lineplot(X1, Y1 + 2, color="orange", label="orange")

plot.legend(bbox_to_anchor=(1.05, 1), loc="lower left")
plot.tight_layout()
plot.show()
But this approach will not give the expected output.
Output:
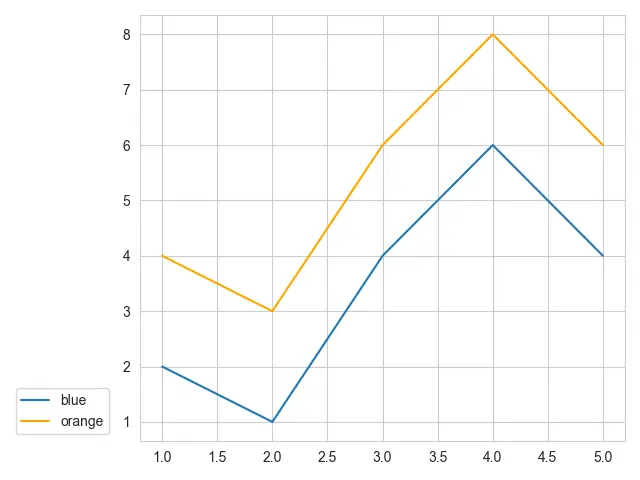
Let’s try another approach to move the legend to the bottom left corner. We only need to pass bbox_to_anchor to the negative 0.05 and 0.
Code:
import seaborn as sb
import numpy as np
import matplotlib.pyplot as plot

sb.set_style("whitegrid")

X1 = np.array([1, 2, 3, 4, 5])
Y1 = np.array([2, 1, 4, 6, 4])

sb.lineplot(X1, Y1, label="blue")
sb.lineplot(X1, Y1 + 2, color="orange", label="orange")

plot.legend(bbox_to_anchor=(-0.05, 0), loc="lower right")
plot.tight_layout()
plot.show()
Now it is moved, and the legend is entirely outside the figure.
Output:
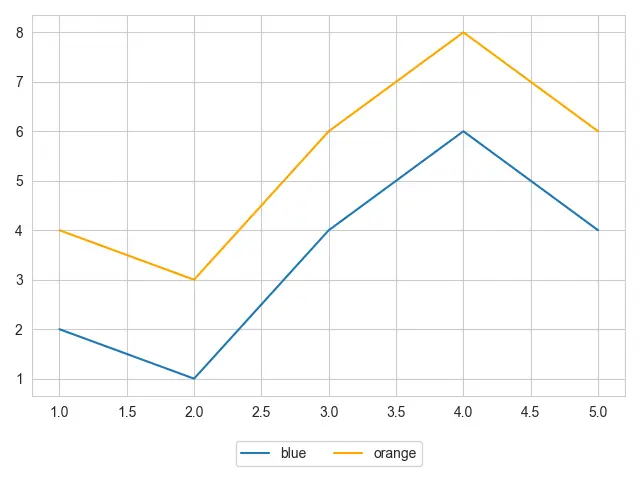
We can also make our legend horizontal using the ncol argument, and this ncol stands for the number of columns. We will put a positive point for x and a negative point for y; our location will be the upper center portion of the legend bounding box.
Code:
import seaborn as sb
import numpy as np
import matplotlib.pyplot as plot

sb.set_style("whitegrid")

X1 = np.array([1, 2, 3, 4, 5])
Y1 = np.array([2, 1, 4, 6, 4])

sb.lineplot(X1, Y1, label="blue")
sb.lineplot(X1, Y1 + 2, color="orange", label="orange")

plot.legend(ncol=2, bbox_to_anchor=(0.5, -0.1), loc="upper center")
plot.tight_layout()
plot.show()
Output:

Hello! I am Salman Bin Mehmood(Baum), a software developer and I help organizations, address complex problems. My expertise lies within back-end, data science and machine learning. I am a lifelong learner, currently working on metaverse, and enrolled in a course building an AI application with python. I love solving problems and developing bug-free software for people. I write content related to python and hot Technologies.
LinkedIn