Seaborn の図の外側に凡例を設定する

この記事は、シーボーンの人物の伝説に関するものです。 凡例を図の外側に配置したり、Seaborn で水平方向の凡例を作成したりするなど、いくつかの異なるヒントを共有します。
Seaborn で bbox_to_anchor 引数を使用して Figure の外側に凡例を設定する
Matplotlib の図に凡例を追加する場合、その凡例の場所は非常に重要です。 Matplotlib は、凡例の最適な位置を自動検出しようとしますが、プロット内で移動することもできます。特に、凡例を Figure の外に完全に移動したい場合があります。
Seaborn を使用して凡例を処理する方法がないため、この問題を解決するには Matplotlib が必要になります。 これらのライブラリを一緒に使用する方法を見てみましょう。
いくつかのライブラリをインポートして、x 軸と y 軸の 2つの配列を作成してみましょう。 また、Seaborn の lineplot() メソッドを使用して 2つの折れ線グラフを作成します。
コード:
import seaborn as sb
import numpy as np
import matplotlib.pyplot as plot
sb.set_style("whitegrid")
X1 = np.array([1, 2, 3, 4, 5])
Y1 = np.array([2, 1, 4, 6, 4])
sb.lineplot(X1, Y1, label="blue")
sb.lineplot(X1, Y1 + 2, color="orange", label="orange")
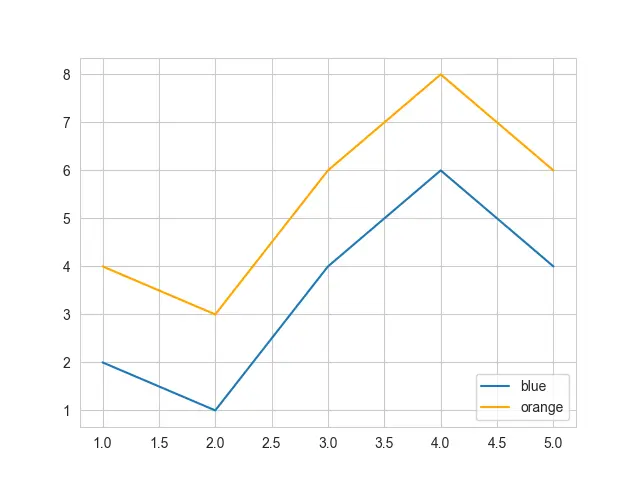
plot.legend(loc="lower right")
plot.show()
凡例関数内に loc という引数があります。 lower right などの文字列を受け入れることができます。これは、凡例を右下隅に配置することを意味します。
出力:
その凡例を図の外に完全に移動する方法については、別のことがあります。 これにはさまざまな方法がありますが、最も簡単な方法を紹介します。
凡例を外側に移動するには、bbox_to_anchor という引数を渡します。 この引数は、x 次元と y 次元に対して 0 から 1 の範囲のタプルを受け入れます。
コード:
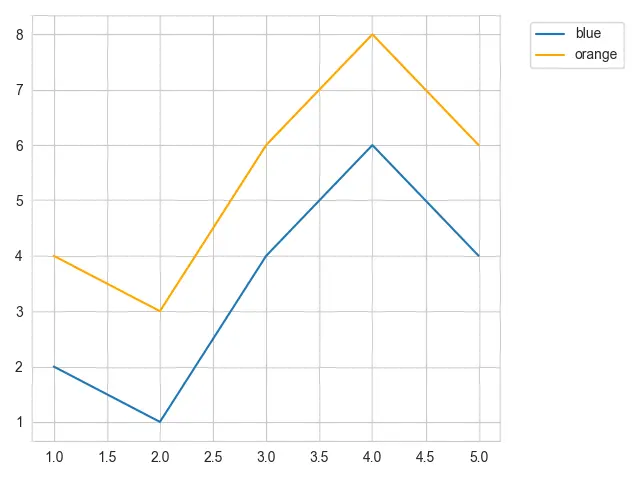
plot.legend(bbox_to_anchor=(1.05, 1), loc="upper left")
したがって、1.05 と 1 を渡すと、凡例が右上隅に移動します。 この bbox_to_anchor アプローチを使用する場合は、loc 引数を使用して、凡例のどの隅を揃えるかを表す必要があります。
コード:
import seaborn as sb
import numpy as np
import matplotlib.pyplot as plot

sb.set_style("whitegrid")

X1 = np.array([1, 2, 3, 4, 5])
Y1 = np.array([2, 1, 4, 6, 4])

sb.lineplot(X1, Y1, label="blue")
sb.lineplot(X1, Y1 + 2, color="orange", label="orange")

plot.legend(bbox_to_anchor=(1.05, 1), loc="upper left")
plot.tight_layout()
plot.show()
左上 を通過しました。これは、凡例の左上隅がスポット 1.05 と 1 になることを意味します。
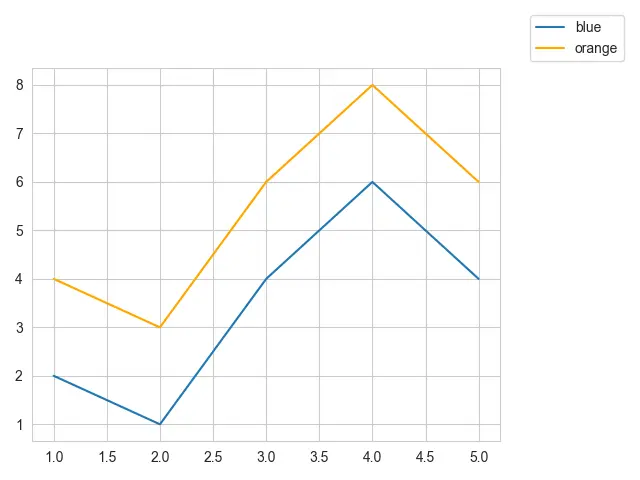
位置を変更すると、たとえば左下にすると、左下隅がその位置に配置されます。
import seaborn as sb
import numpy as np
import matplotlib.pyplot as plot

sb.set_style("whitegrid")

X1 = np.array([1, 2, 3, 4, 5])
Y1 = np.array([2, 1, 4, 6, 4])

sb.lineplot(X1, Y1, label="blue")
sb.lineplot(X1, Y1 + 2, color="orange", label="orange")

plot.legend(bbox_to_anchor=(1.05, 1), loc="lower left")
plot.tight_layout()
plot.show()
しかし、このアプローチでは期待どおりの結果が得られません。
出力:
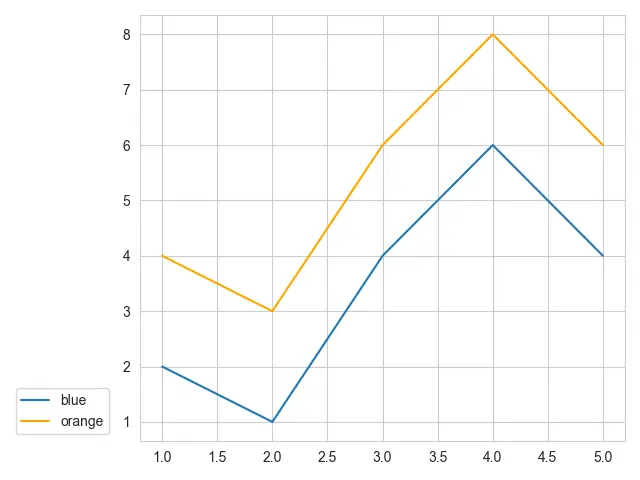
凡例を左下隅に移動する別の方法を試してみましょう。 bbox_to_anchor を負の 0.05 と 0 に渡すだけです。
コード:
import seaborn as sb
import numpy as np
import matplotlib.pyplot as plot

sb.set_style("whitegrid")

X1 = np.array([1, 2, 3, 4, 5])
Y1 = np.array([2, 1, 4, 6, 4])

sb.lineplot(X1, Y1, label="blue")
sb.lineplot(X1, Y1 + 2, color="orange", label="orange")

plot.legend(bbox_to_anchor=(-0.05, 0), loc="lower right")
plot.tight_layout()
plot.show()
現在は移動されており、凡例は完全に Figure の外側にあります。
出力:
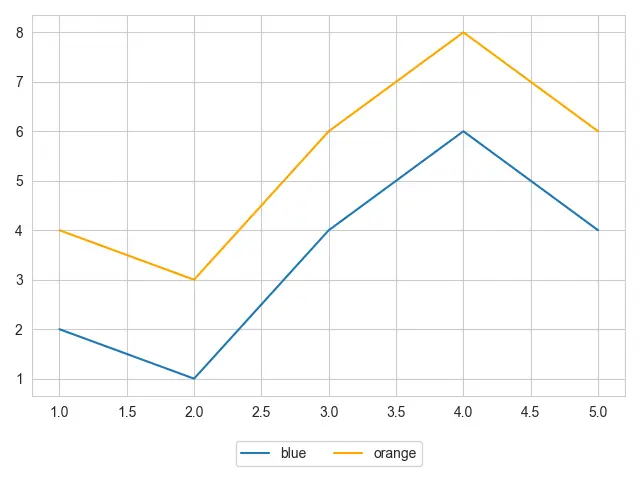
ncol 引数を使用して凡例を水平にすることもできます。この ncol は列数を表します。 x には正の点を、y には負の点を置きます。 私たちの場所は、凡例の境界ボックスの 上中央 の部分になります。
コード:
import seaborn as sb
import numpy as np
import matplotlib.pyplot as plot

sb.set_style("whitegrid")

X1 = np.array([1, 2, 3, 4, 5])
Y1 = np.array([2, 1, 4, 6, 4])

sb.lineplot(X1, Y1, label="blue")
sb.lineplot(X1, Y1 + 2, color="orange", label="orange")

plot.legend(ncol=2, bbox_to_anchor=(0.5, -0.1), loc="upper center")
plot.tight_layout()
plot.show()
出力:

Hello! I am Salman Bin Mehmood(Baum), a software developer and I help organizations, address complex problems. My expertise lies within back-end, data science and machine learning. I am a lifelong learner, currently working on metaverse, and enrolled in a course building an AI application with python. I love solving problems and developing bug-free software for people. I write content related to python and hot Technologies.
LinkedIn