How to Perform Normal Distribution in R
The Normal Distribution is a probability function that shows us how the data is distributed. The normal distribution is one of the most important probability distribution methods used in statistics because it provides many advantages in real case scenarios.
This tutorial demonstrates how to perform and plot Normal Distribution in R.
Normal Distribution in R
There are four built-in functions in base R used to perform Normal Distribution.
dnorm(x, mean, sd)
pnorm(x, mean, sd)
qnorm(p, mean, sd)
rnorm(n, mean, sd)
Where:
x= vector of numbersp= vector of probabilitiesn= number of observationsmean= the mean value of sample datasd= standard deviation
The default value for the mean is 0, and for sd is 1. Let’s define and solve the functions one by one.
dnorm(x, mean, sd) in R
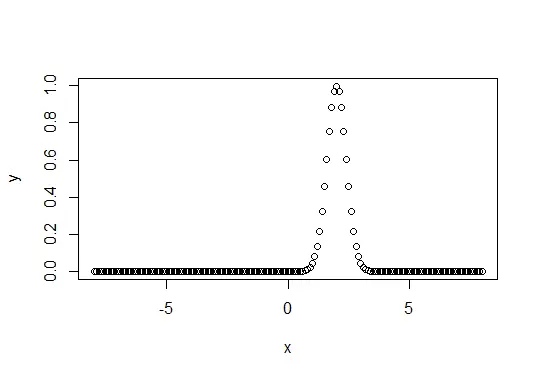
The dnorm() is used to get the height of probability distribution for each point with a given standard deviation and mean. Let’s try an example in R.
# a sequence of numbers between -8 and 8 incrementing by 0.1.
# it will passed to dnorm as x
x <- seq(-8, 8, by = .1)

# we chose mean as 2 and standard deviation as 0.4.
y <- dnorm(x, mean = 2, sd = 0.4)

plot(x,y)
The code above will plot the normal distribution using dnorm with mean 2 and sd 0.4 for the given sequence. See output plot:
pnorm(x, mean, sd) in R
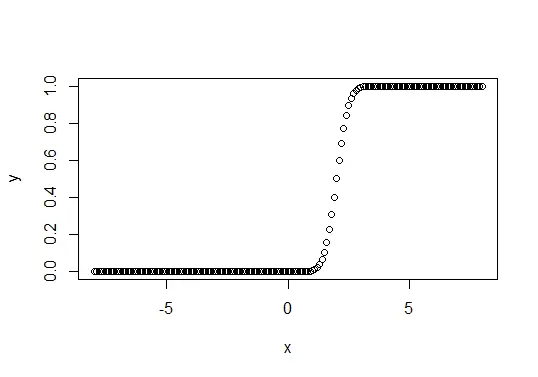
The pnorm() is used to get the probability of a normally distributed number less than the given number. This function is also known as the Cumulative Distribution Function.
Let’s try an example.
# a sequence of numbers between -8 and 8 incrementing by 0.1.
# it will passed to pnorm as x
x <- seq(-8, 8, by = .1)

# we chose mean as 2 and standard deviation as 0.4.
y <- pnorm(x, mean = 2, sd = 0.4)

plot(x,y)
The code above will plot the normal distribution using pnorm with mean 2 and sd 0.4 for the given sequence. See output plot:
qnorm(p, mean, sd) in R
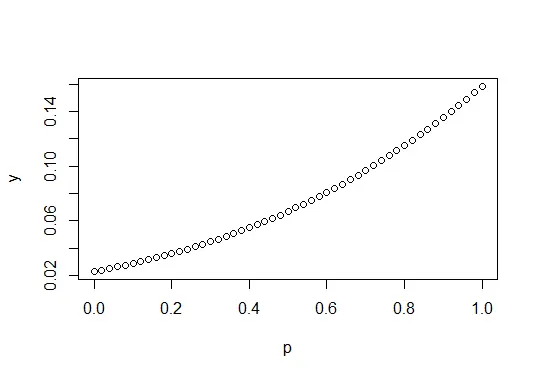
The qnorm will take a probability value and return a number with a cumulative value similar to the given probability value. See example:
# sequence of probability values incrementing by 0.01.
# it will be passed to pnorm as x
p <- seq(0, 1, by = 0.02)

# we chose mean as 2 and standard deviation as 1.
y <- pnorm(p, mean = 2, sd = 1)

plot(p,y)
The code above will plot the normal distribution using qnorm with mean 2 and sd 2 for the given probability sequence. See output plot:
rnorm(n, mean, sd) in R
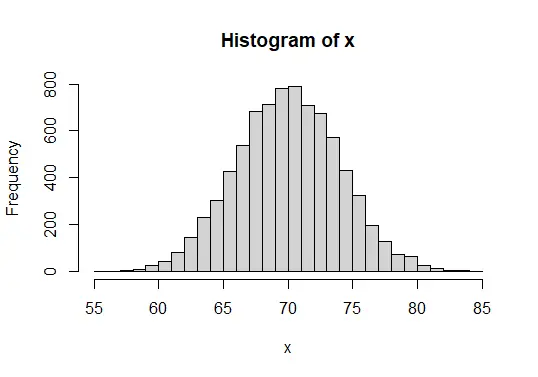
The rnorm is used to create a random number for which the distribution is normal; it will take a number as input and generate a random number equal to it. Let’s try an example.
# vector of 8000 random numbers with mean 70 and standard deviation 4

x <- rnorm(8000, mean=70, sd=4)

# histogram with 40 bars
hist(x, breaks=40)
The code above will show a histogram of the rnorm probability distribution using 8000 random numbers with a mean of 70 and sd 4. See output:

Sheeraz is a Doctorate fellow in Computer Science at Northwestern Polytechnical University, Xian, China. He has 7 years of Software Development experience in AI, Web, Database, and Desktop technologies. He writes tutorials in Java, PHP, Python, GoLang, R, etc., to help beginners learn the field of Computer Science.
LinkedIn Facebook