OpenCV Image Point
This tutorial will discuss the point notation of images in OpenCV.
Point Notation of Images in OpenCV
In the x and y coordinate system, the original lies at point (0, 0), the x-axis starts from origin and moves toward the right, and the y-axis also starts from origin and moves upward.
In the case of images in OpenCV, the origin lies at the image’s top-left corner, and the x-axis starts from the top-left corner and moves toward the right. The y-axis also starts from the top-left corner then moves toward the bottom of the image.
For example, if we want to represent the location of the 2nd pixel of an image, we can use the point (0, 1) where x=1 and y=0.
In OpenCV, images are stored as matrices; we can also use the row-column notation for the points where the first value of the point represents row number and the second value represents column number.
In this case, a point (y, x) will be equal to a point (row, column), and the point (x, y) will be equal to a point (column, row).
So if we write a point value like (1, 0) in OpenCV, the code will take 1 as row number of y-axis value and 0 as column number or x-axis value.
As we know, the column moves from left to write in a matrix, and the x-axis also movers from left to write, which means x will be equal to the column and y will be equal to row.
For example, to represent the location of the 2nd pixel of an image in column-row notation, we will write it as (0, 1), which means the 2nd column and first row.
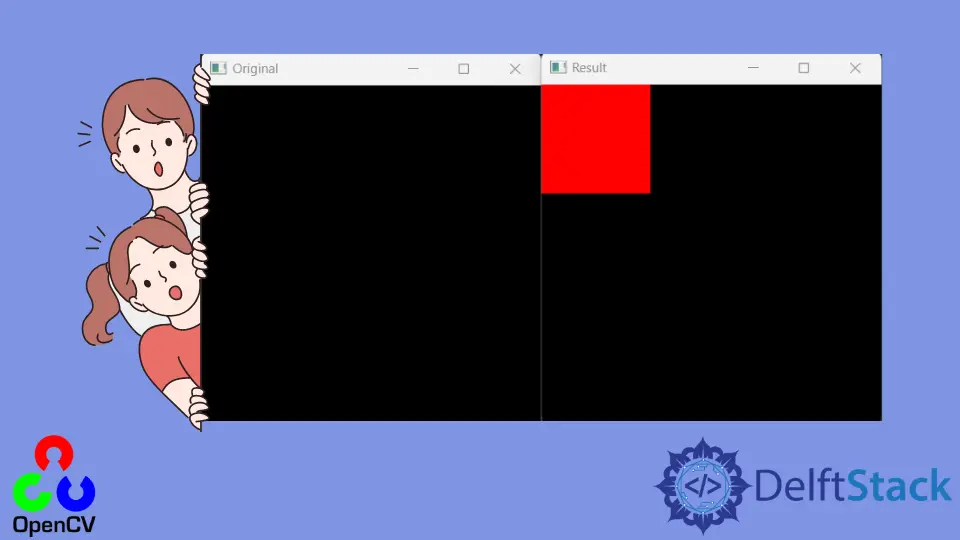
Now let’s consider an image in which we want to change the color of the top-left corner of the image in OpenCV. We will change the color of the first few rows and columns to change the column’s color.
See the code below.
import cv2
import numpy as np

x = np.zeros((312, 312, 3), dtype=np.float32)
cv2.imshow("Original", x)

x[0:100, 0:100] = (0, 0, 255)

cv2.imshow("Result", x)
cv2.waitKey(0)
Output:
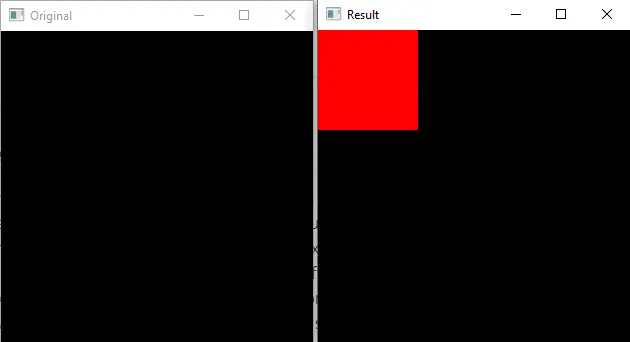
We used the zeros() function of NumPy to create a black image in the above code. We changed the color of the first 100 rows and columns to the color red, and we can see the result in the above output.
Now let’s add two lines in the above image, one for rows and one for columns.
See the code below.
import cv2
import numpy as np

x = np.zeros((312, 312, 3), dtype=np.float32)
cv2.imshow("Original", x)

x[0:10, :] = (0, 0, 255)  # red
x[:, 0:10] = (255, 0, 0)  # blue

cv2.imshow("Result", x)
cv2.waitKey(0)
Output:
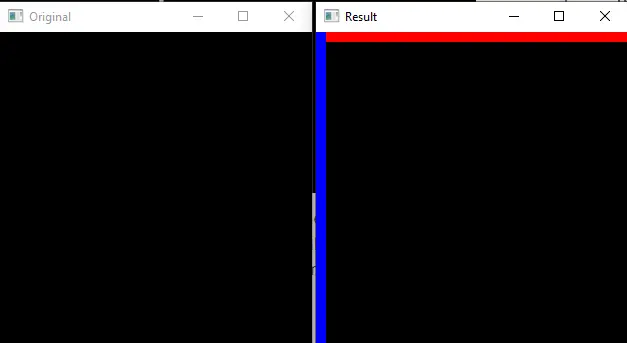
In the above code, we changed the color of the first 10 rows and all columns to red color and the color of the first 10 columns and all rows to blue, and we can see the result in the above output.
That means to use the point system (x, y), we need to write it as (y, x) or (row, column) in case of images.
OpenCV uses BGR color space, so the triplet value (0, 0, 255) in the above code represents red.
