How to Calculate Average Color of Image in OpenCV
-
Use the
average()Function of NumPy to Find the Average Color of Images in Python -
Use the
KMeans()Function ofsklearnto Find the Dominant Colors in Images in Python

This tutorial will discuss finding the average color of an image using the average() function of NumPy in Python.
Use the average() Function of NumPy to Find the Average Color of Images in Python
In mathematics, we can find the average of a vector by dividing the sum of all the elements in the vector by the total number of elements. An image is composed of pixels, and each pixel has a specific color defined by the RGB triplet value.
To find the average color in an image, we have to take the average of all the RGB triplet values. We can use the imread() function to read the image and store it in a matrix.
We can use the average() function of NumPy to find the average of the image matrix and display it using the print function.
We can also create a black image using the ones() function of NumPy and then put the average color in this image and show it using the imshow() function of OpenCV.
See the code below.
import cv2
import numpy as np

src_img = cv2.imread("fruit.jpg")
average_color_row = np.average(src_img, axis=0)
average_color = np.average(average_color_row, axis=0)
print(average_color)

d_img = np.ones((312, 312, 3), dtype=np.uint8)
d_img[:, :] = average_color

cv2.imshow("Source image", src_img)
cv2.imshow("Average Color", d_img)
cv2.waitKey(0)
Output:
[ 66.37342135 132.52483748 176.58277285]
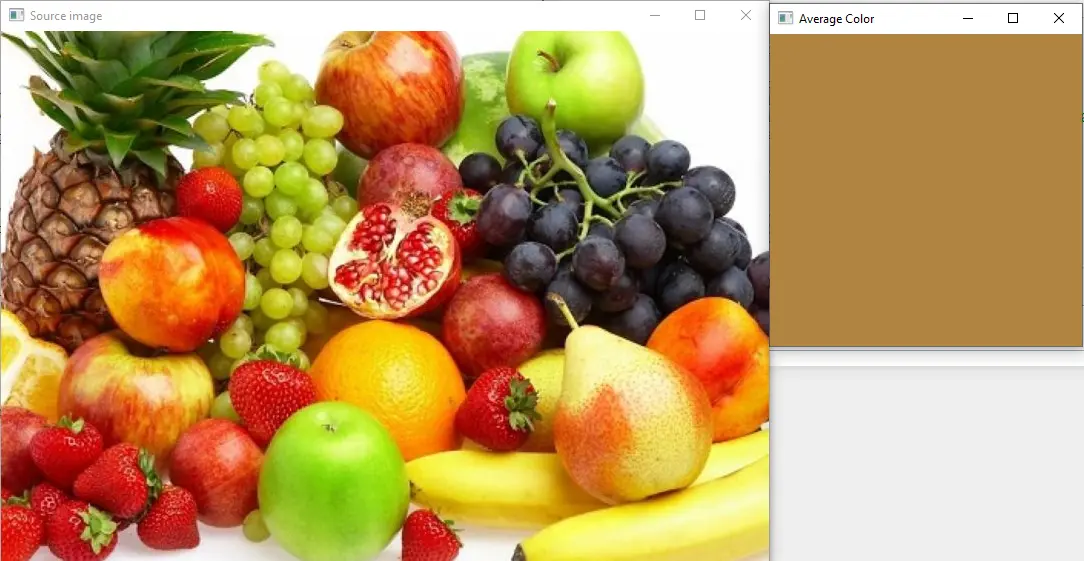
The RGB triplet value is saved in the average_color variable, and it is also shown along with the source image. The first argument in the average() function is the source image.
The second argument specifies the direction in which the average will occur. In the above code, axis=0 takes the average rows in the image matrix.
The average() function is used twice in the above code. We used it the first time to take the average of all the rows.
Then we used it again to take the average output from the first average() function because the matrix is 2 dimensional, and the average() function only works in one dimension.
Use the KMeans() Function of sklearn to Find the Dominant Colors in Images in Python
Instead of finding a single average color, we can also find the most dominant colors in an image using the k_mean clustering algorithm.
For example, to find five dominant colors in an image, we can make five clusters of the colors in the given image using the KMeans() function of the sklearn library.
This function works on the nearest neighbors principle in which the nearest value to a pixel will be placed in that pixel’s cluster and so on.
For example, if one cluster contains black color, the other colors near the black color will also be placed inside this cluster and so on. Then we can find which color is dominant in each cluster using the histogram of the clusters.
We can show the dominant colors using the rectangle() function of OpenCV. We will also display the percentage of the dominant colors.
See the code below.
import cv2
import numpy as np
from sklearn.cluster import KMeans


def visualize_Dominant_colors(cluster, C_centroids):
    C_labels = np.arange(0, len(np.unique(cluster.labels_)) + 1)
    (C_hist, _) = np.histogram(cluster.labels_, bins=C_labels)
    C_hist = C_hist.astype("float")
    C_hist /= C_hist.sum()

    rect_color = np.zeros((50, 300, 3), dtype=np.uint8)
    img_colors = sorted(
        [(percent, color) for (percent, color) in zip(C_hist, C_centroids)]
    )
    start = 0
    for (percent, color) in img_colors:
        print(color, "{:0.2f}%".format(percent * 100))
        end = start + (percent * 300)
        cv2.rectangle(
            rect_color,
            (int(start), 0),
            (int(end), 50),
            color.astype("uint8").tolist(),
            -1,
        )
        start = end
    return rect_color


# Load image
src_image = cv2.imread("fruit.jpg")
src_image = cv2.cvtColor(src_image, cv2.COLOR_BGR2RGB)
reshape_img = src_image.reshape((src_image.shape[0] * src_image.shape[1], 3))

# Display dominant colors Present in the image
KM_cluster = KMeans(n_clusters=5).fit(reshape_img)
visualize_color = visualize_Dominant_colors(KM_cluster, KM_cluster.cluster_centers_)
visualize_color = cv2.cvtColor(visualize_color, cv2.COLOR_RGB2BGR)
cv2.imshow("visualize_Color", visualize_color)
cv2.waitKey()
Output:
[250.02183207 247.76400891 234.31283544] 10.79%
[229.50988728 214.10649735 107.32981816] 17.88%
[191.01593309  56.83353011  24.6890951 ] 22.11%
[75.10083377 57.61393153 30.72486672] 24.38%
[193.66472128 165.29669679  36.39122105] 24.84%
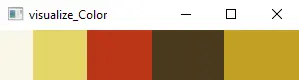
As shown, the RGB triplet value along with the percentage of dominant colors is shown in the output. OpenCV reads images in BRG color space that why we converted the image to RGB using the cvtColor() function of OpenCV.
The zeros() function in the above code is used to create a blank image, and then we used the rectangle() function to create rectangles of dominant colors according to their percentage on top of the blank image.
The value of the number of clusters is set to 5 in the above code, but we can use as many clusters as we want.
If we use 10 clusters, the code will return the dominant colors, but the code will take more time than 5 clusters. We can also set many other arguments in the KMeans() function, like the max iterations using the max_iter argument set to 300 by default.
We can also set the tolerance using the tol argument set to 0.0001 by default and the algorithm used to find the clusters set to auto by default. Check this link for more details about the KMeans() function.
The first argument of the rectangle() function is the image on which we want to draw the color box. The second argument is the starting position, which will set the rectangle’s starting point.
The third argument is the ending position of the rectangle. The fourth argument defines the rectangle’s color in BGR triplet format, and the fifth argument is the line thickness of the rectangle.
If the line thickness is set to -1, the rectangle will be filled with color.
