How to Profile a Python Code
Profiling is a technique that displays the statistics about how much time a script needs to execute and how often it executes. Through this, we can understand which part of the code needs to optimize and make the program efficient.
Use cProfile to Profile a Python Code
cProfile is a built-in module in Python that measures the execution time of a program and also shows how often a method is called. To profile a Python code, we will write the code or the method name as a string argument in the run() method call.
Along with the total running time of the program, it also shows how much time a particular method takes to run.
In the following code, we have written a simple comparison operation as a string in the run() method call. The output shows all the statistics of that code.
Example Code:
import cProfile

cProfile.run("0 < 1")
Output:
3 function calls in 0.000 seconds

   Ordered by: standard name

   ncalls  tottime  percall  cumtime  percall filename:lineno(function)
        1    0.000    0.000    0.000    0.000 <string>:1(<module>)
        1    0.000    0.000    0.000    0.000 {built-in method builtins.exec}
        1    0.000    0.000    0.000    0.000 {method 'disable' of '_lsprof.Profiler' objects}
Now, let’s write a code that took significant time with many method calls in the back end. In the following code, we have created a method containing nested loops that append the numbers to a list.
We will pass its name to the run() method to profile this method. The output shows all the statistics about this code.
Example Code:
import cProfile


def func():
    num = []
    for i in range(1, 100):
        for j in range(1, 100):
            num.append(j)


cProfile.run("func()")
Output:
9805 function calls in 0.009 seconds

   Ordered by: standard name

   ncalls  tottime  percall  cumtime  percall filename:lineno(function)
        1    0.006    0.006    0.009    0.009 <ipython-input-3-d9419f0448d8>:2(func)
        1    0.000    0.000    0.009    0.009 <string>:1(<module>)
        1    0.000    0.000    0.009    0.009 {built-in method builtins.exec}
     9801    0.003    0.000    0.003    0.000 {method 'append' of 'list' objects}
        1    0.000    0.000    0.000    0.000 {method 'disable' of '_lsprof.Profiler' objects}
Use SnakeViz to Visualize the Profile Results in Python
SnakeViz is a web-based tool for profiling visualization. We can install and use it easily.
pip install snakeviz
Suppose we want to profile and visualize the results of the following code. We have to save the code in a py file in Python’s environment.
We have three functions, each containing a loop that runs 1000 times and performs some arithmetic operations.
Example Code:
def func():
    a = 1
    b = 2
    for i in range(1, 1000):
        a += b


def func2():
    a = 1
    b = 2
    for i in range(1, 1000):
        a -= b


def func3():
    a = 1
    b = 2
    for i in range(1, 1000):
        a *= b


func()
func2()
func3()
We will use the following commands to profile and visualize the results.
python -m cProfile -o temp.dat My_Script.py
snakeviz temp.dat
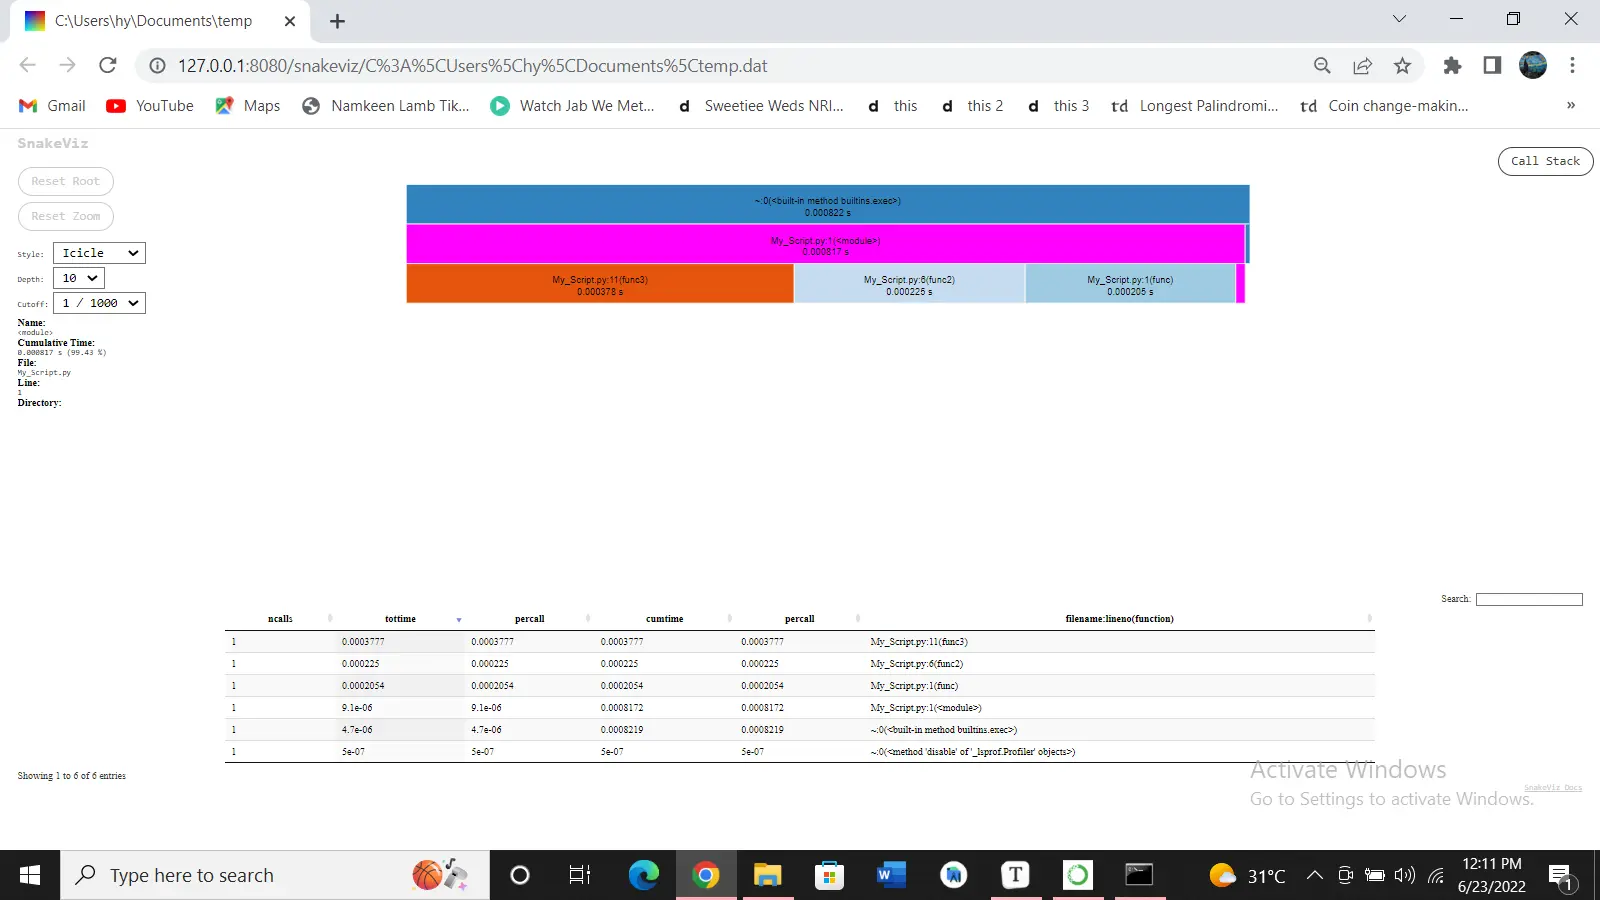
Output:
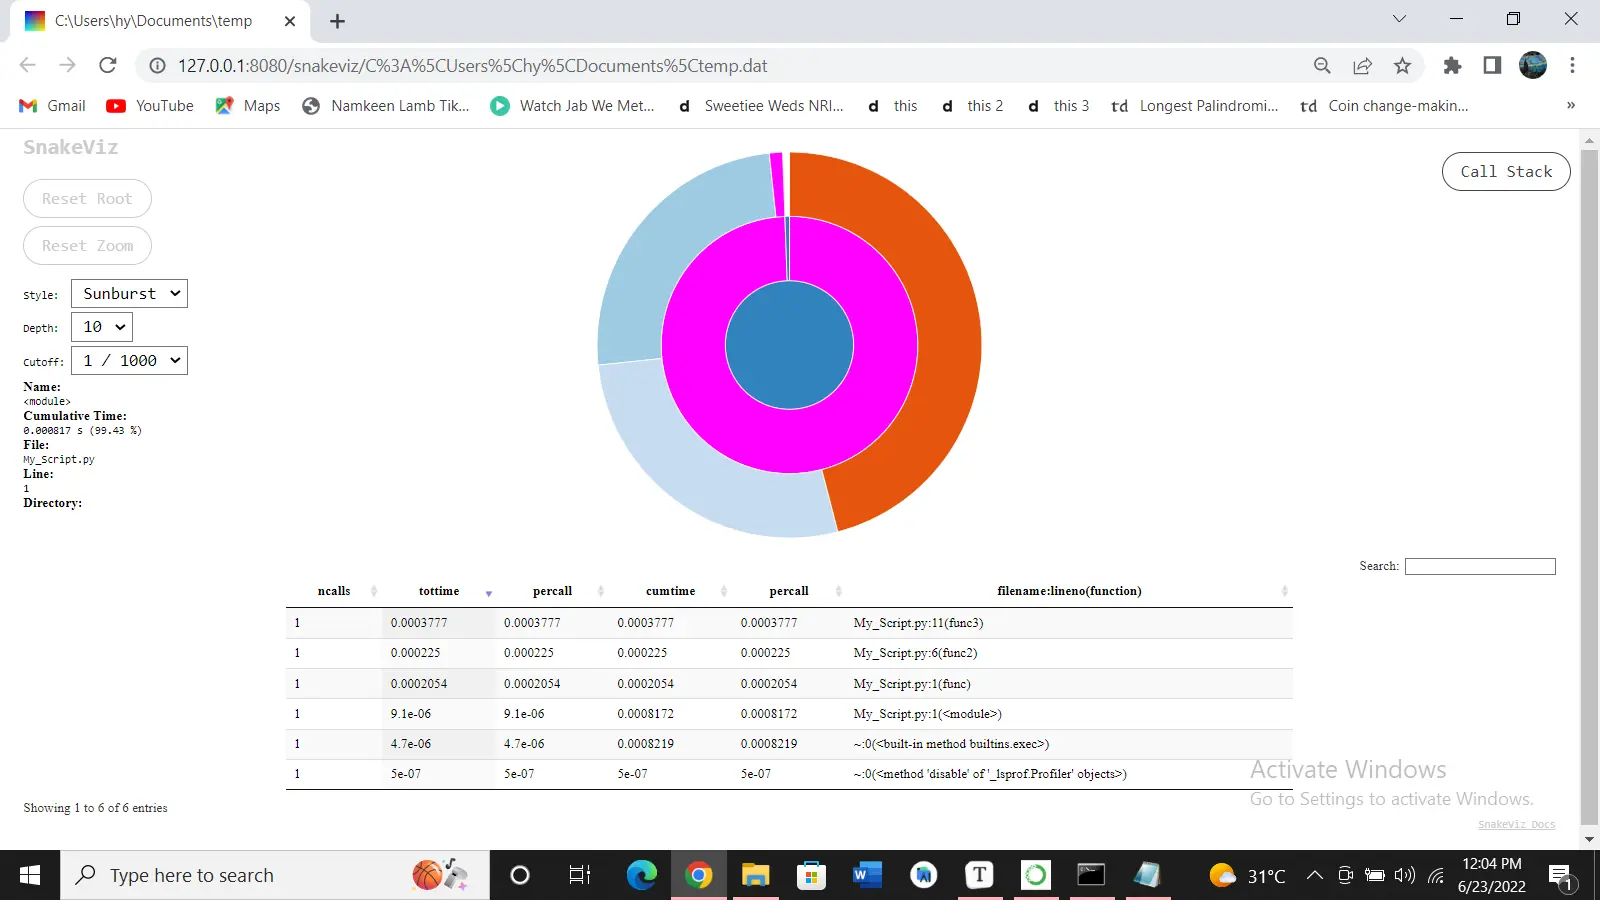
Icicle (the default) and Sunburst are the two visualization modes offered by SnakeViz. In the case of Icicle, the width of a rectangle describes the amount of time spent in a function.
The arc’s angular extent represents the execution time if we switch to Sunburst. Using the Style option, we can change the two styles.

I am Fariba Laiq from Pakistan. An android app developer, technical content writer, and coding instructor. Writing has always been one of my passions. I love to learn, implement and convey my knowledge to others.
LinkedIn