分析 Python 代码
分析是一种显示有关脚本需要执行多长时间以及执行频率的统计信息的技术。通过这个,我们可以了解代码的哪一部分需要优化,让程序变得高效。
使用 cProfile 分析 Python 代码
cProfile 是 Python 中的一个内置模块,用于测量程序的执行时间并显示方法被调用的频率。要分析 Python 代码,我们将在 run() 方法调用中编写代码或方法名称作为字符串参数。
除了程序的总运行时间外,它还显示特定方法运行所需的时间。
在下面的代码中,我们在 run() 方法调用中编写了一个简单的比较操作作为字符串。输出显示了该代码的所有统计信息。
示例代码:
import cProfile

cProfile.run("0 < 1")
输出:
3 function calls in 0.000 seconds

   Ordered by: standard name

   ncalls  tottime  percall  cumtime  percall filename:lineno(function)
        1    0.000    0.000    0.000    0.000 <string>:1(<module>)
        1    0.000    0.000    0.000    0.000 {built-in method builtins.exec}
        1    0.000    0.000    0.000    0.000 {method 'disable' of '_lsprof.Profiler' objects}
现在,让我们编写一段代码,该代码在后端有许多方法调用需要大量时间。在下面的代码中,我们创建了一个方法,其中包含将数字附加到列表的嵌套循环。
我们将把它的名字传递给 run() 方法来分析这个方法。输出显示有关此代码的所有统计信息。
示例代码:
import cProfile


def func():
    num = []
    for i in range(1, 100):
        for j in range(1, 100):
            num.append(j)


cProfile.run("func()")
输出:
9805 function calls in 0.009 seconds

   Ordered by: standard name

   ncalls  tottime  percall  cumtime  percall filename:lineno(function)
        1    0.006    0.006    0.009    0.009 <ipython-input-3-d9419f0448d8>:2(func)
        1    0.000    0.000    0.009    0.009 <string>:1(<module>)
        1    0.000    0.000    0.009    0.009 {built-in method builtins.exec}
     9801    0.003    0.000    0.003    0.000 {method 'append' of 'list' objects}
        1    0.000    0.000    0.000    0.000 {method 'disable' of '_lsprof.Profiler' objects}
使用 SnakeViz 在 Python 中可视化配置文件结果
SnakeViz 是一个基于网络的可视化分析工具。我们可以轻松安装和使用它。
pip install snakeviz
假设我们想要分析和可视化以下代码的结果。我们必须将代码保存在 Python 环境中的 py 文件中。
我们有三个函数,每个函数都包含一个运行 1000 次并执行一些算术运算的循环。
示例代码:
def func():
    a = 1
    b = 2
    for i in range(1, 1000):
        a += b


def func2():
    a = 1
    b = 2
    for i in range(1, 1000):
        a -= b


def func3():
    a = 1
    b = 2
    for i in range(1, 1000):
        a *= b


func()
func2()
func3()
我们将使用以下命令来分析和可视化结果。
python -m cProfile -o temp.dat My_Script.py
snakeviz temp.dat
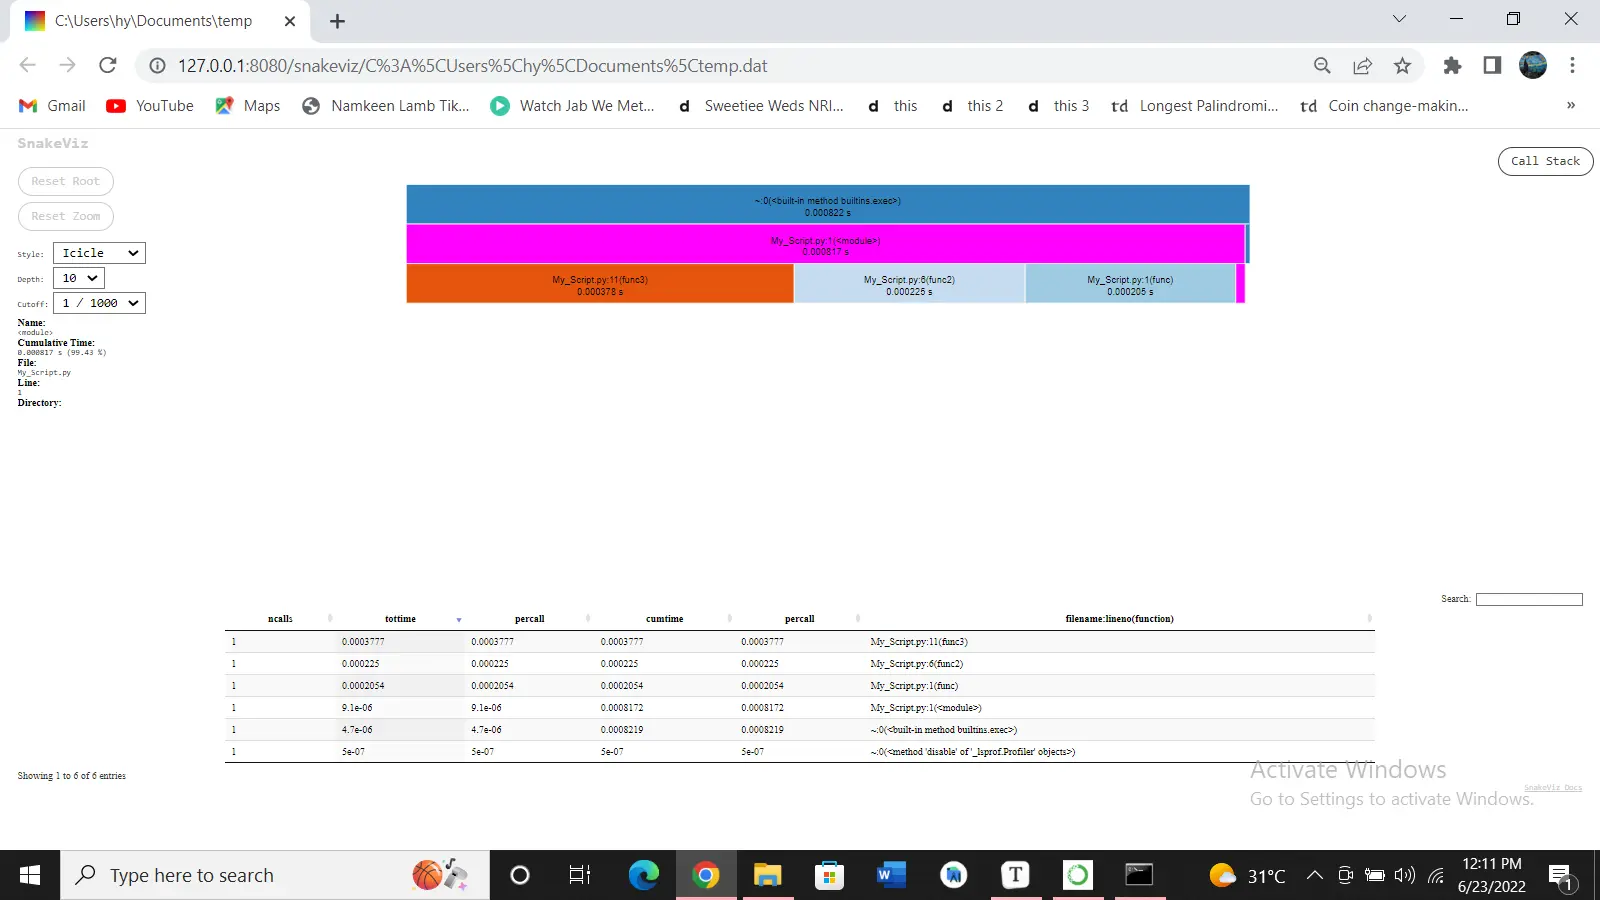
输出:
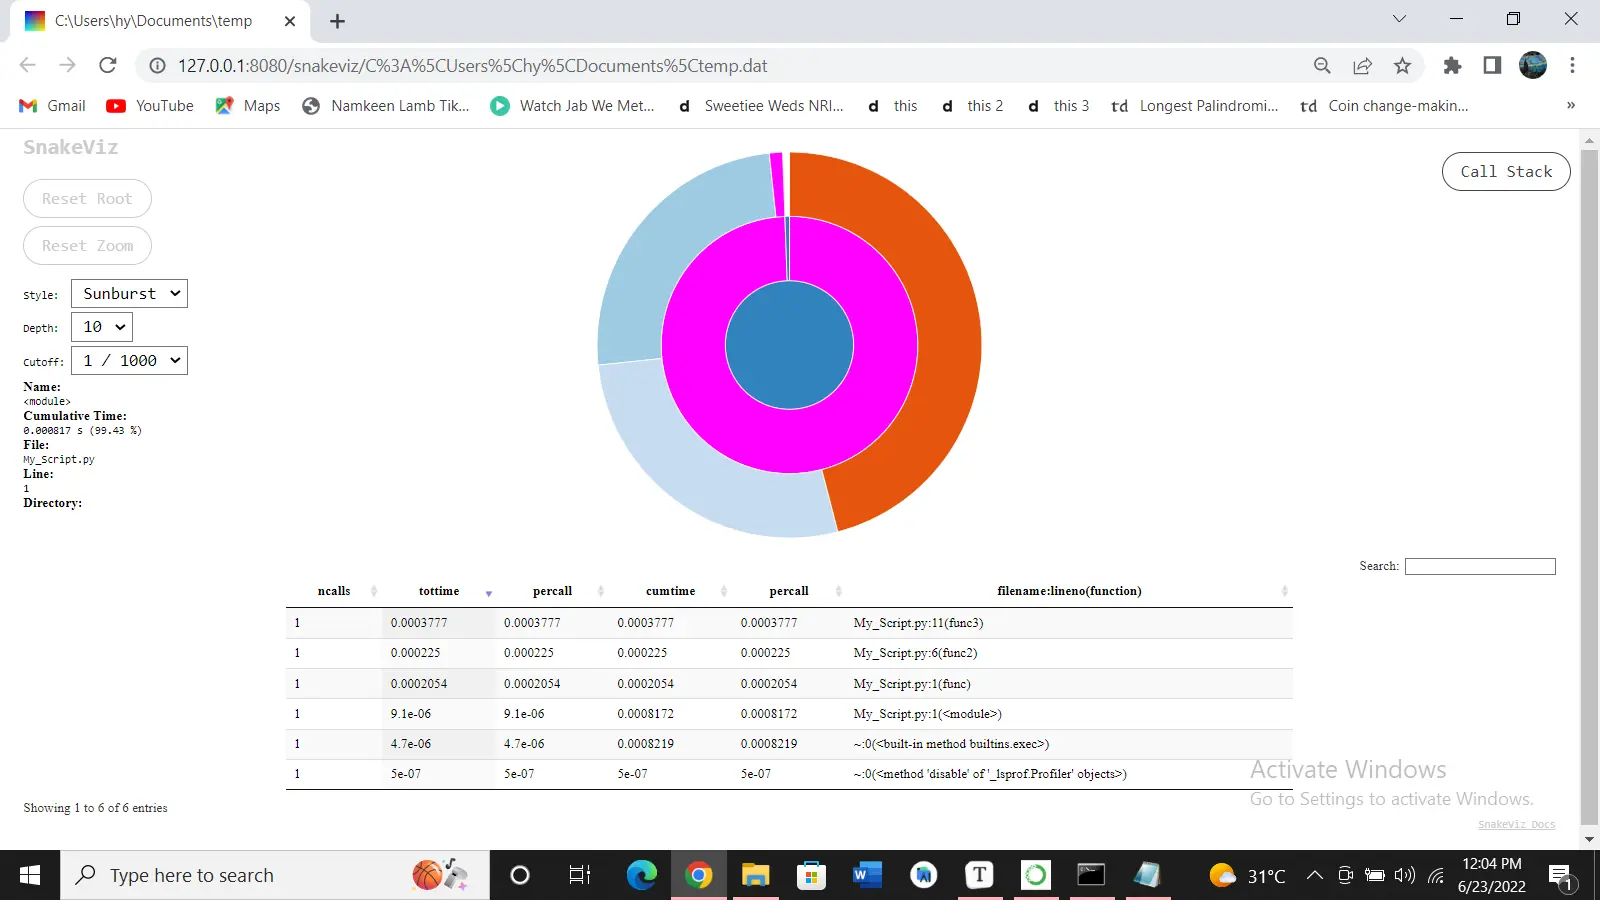
Icicle(默认)和 Sunburst 是 SnakeViz 提供的两种可视化模式。在 Icicle 的情况下,矩形的宽度描述了在函数中花费的时间量。
如果我们切换到 Sunburst,弧的角度范围表示执行时间。使用 Style 选项,我们可以更改两种样式。

I am Fariba Laiq from Pakistan. An android app developer, technical content writer, and coding instructor. Writing has always been one of my passions. I love to learn, implement and convey my knowledge to others.
LinkedIn