分析 Python 程式碼
分析是一種顯示有關指令碼需要執行多長時間以及執行頻率的統計資訊的技術。通過這個,我們可以瞭解程式碼的哪一部分需要優化,讓程式變得高效。
使用 cProfile 分析 Python 程式碼
cProfile 是 Python 中的一個內建模組,用於測量程式的執行時間並顯示方法被呼叫的頻率。要分析 Python 程式碼,我們將在 run() 方法呼叫中編寫程式碼或方法名稱作為字串引數。
除了程式的總執行時間外,它還顯示特定方法執行所需的時間。
在下面的程式碼中,我們在 run() 方法呼叫中編寫了一個簡單的比較操作作為字串。輸出顯示了該程式碼的所有統計資訊。
示例程式碼:
import cProfile

cProfile.run("0 < 1")
輸出:
3 function calls in 0.000 seconds

   Ordered by: standard name

   ncalls  tottime  percall  cumtime  percall filename:lineno(function)
        1    0.000    0.000    0.000    0.000 <string>:1(<module>)
        1    0.000    0.000    0.000    0.000 {built-in method builtins.exec}
        1    0.000    0.000    0.000    0.000 {method 'disable' of '_lsprof.Profiler' objects}
現在,讓我們編寫一段程式碼,該程式碼在後端有許多方法呼叫需要大量時間。在下面的程式碼中,我們建立了一個方法,其中包含將數字附加到列表的巢狀迴圈。
我們將把它的名字傳遞給 run() 方法來分析這個方法。輸出顯示有關此程式碼的所有統計資訊。
示例程式碼:
import cProfile


def func():
    num = []
    for i in range(1, 100):
        for j in range(1, 100):
            num.append(j)


cProfile.run("func()")
輸出:
9805 function calls in 0.009 seconds

   Ordered by: standard name

   ncalls  tottime  percall  cumtime  percall filename:lineno(function)
        1    0.006    0.006    0.009    0.009 <ipython-input-3-d9419f0448d8>:2(func)
        1    0.000    0.000    0.009    0.009 <string>:1(<module>)
        1    0.000    0.000    0.009    0.009 {built-in method builtins.exec}
     9801    0.003    0.000    0.003    0.000 {method 'append' of 'list' objects}
        1    0.000    0.000    0.000    0.000 {method 'disable' of '_lsprof.Profiler' objects}
使用 SnakeViz 在 Python 中視覺化配置檔案結果
SnakeViz 是一個基於網路的視覺化分析工具。我們可以輕鬆安裝和使用它。
pip install snakeviz
假設我們想要分析和視覺化以下程式碼的結果。我們必須將程式碼儲存在 Python 環境中的 py 檔案中。
我們有三個函式,每個函式都包含一個執行 1000 次並執行一些算術運算的迴圈。
示例程式碼:
def func():
    a = 1
    b = 2
    for i in range(1, 1000):
        a += b


def func2():
    a = 1
    b = 2
    for i in range(1, 1000):
        a -= b


def func3():
    a = 1
    b = 2
    for i in range(1, 1000):
        a *= b


func()
func2()
func3()
我們將使用以下命令來分析和視覺化結果。
python -m cProfile -o temp.dat My_Script.py
snakeviz temp.dat
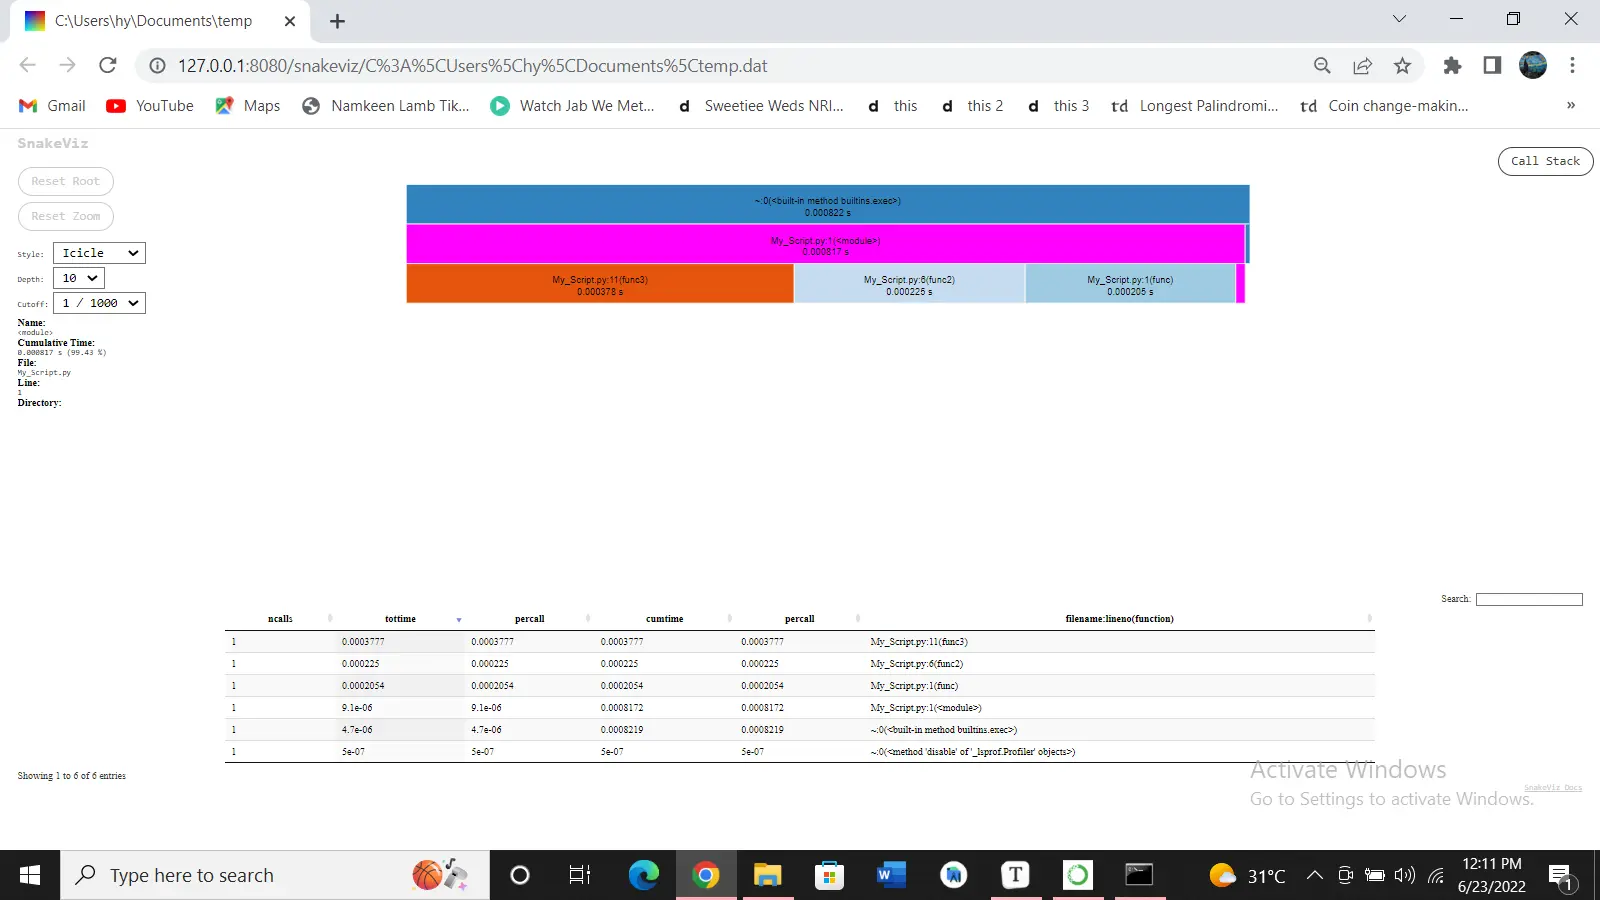
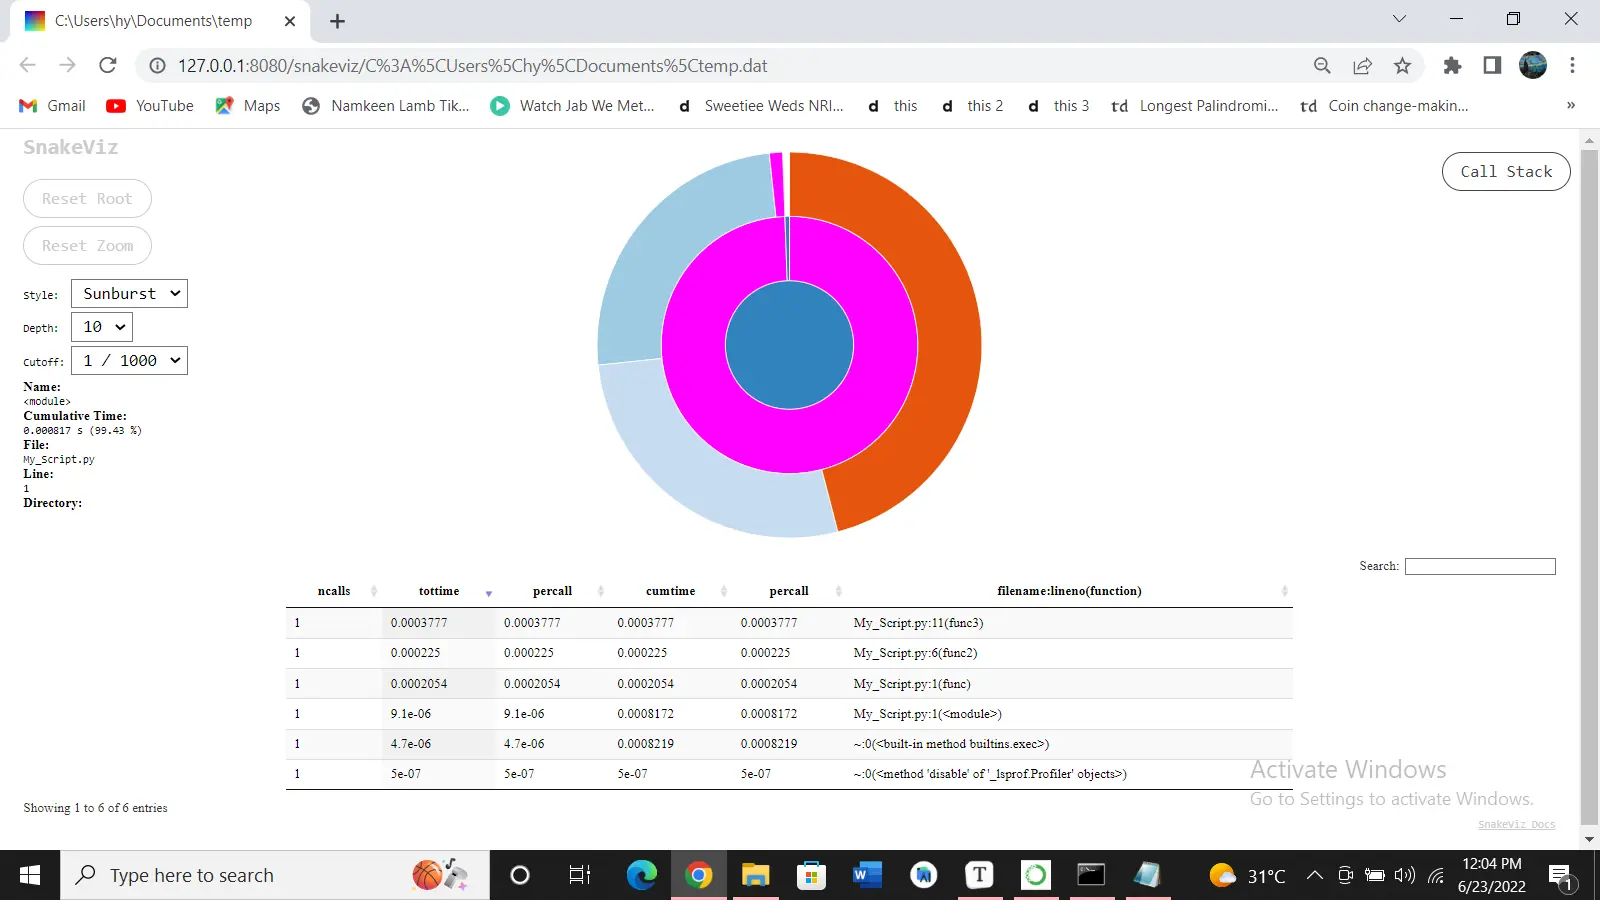
輸出:
Icicle(預設)和 Sunburst 是 SnakeViz 提供的兩種視覺化模式。在 Icicle 的情況下,矩形的寬度描述了在函式中花費的時間量。
如果我們切換到 Sunburst,弧的角度範圍表示執行時間。使用 Style 選項,我們可以更改兩種樣式。

I am Fariba Laiq from Pakistan. An android app developer, technical content writer, and coding instructor. Writing has always been one of my passions. I love to learn, implement and convey my knowledge to others.
LinkedIn