How to Profile a Python Code Line by Line
- What is Profiling
-
Profile Python Code Using
line_profilerModule - Profile Python Code via Command Line

This article explains how someone can profile Python code line-by-line and get useful information about code execution.
First, we will briefly introduce profiling; then, we will discuss when line-by-line profiling is better to use than function base profiling. After that, we will discuss the profiling implementation in Python.
What is Profiling
Profiling is the process of checking the resources utilized by different parts of our code. For efficient coding practices, we are generally mostly concerned with either time complexity (time taken by different coding units/functions) or memory complexity (memory utilization by different coding units/functions).
The former helps us focus on reducing the time taken by the program, and the latter helps us optimize memory usage.
Function Profiling
Majorly in any language, function level profiling is used to find out the time consumed by different functions of the program. Therefore, the Python default package already includes libraries cProfile and Profile for function profiling.
Line Profiler
The function-based profiler gives information about the time taken by the different functions. However, we sometimes need line-based time complexity to check which line contributes more to the overall time taken by the function or the program.
We have the line_profiler library in Python for such a case.
Profile Python Code Using line_profiler Module
The LineProfiler module allows us to profile code line-by-line or by function.
In the following Python code snippet, we have created two functions named slow_avg_producer() and fast_average_producer(). Both these functions produce the same average, but their execution time is different.
First, install the following module to profile the code using the line profiler.
!pip install line_profiler
import time
import random


def slow_avg_producer():
    time.sleep(6)  # Do nothing for 5 time units
    # generate random numbers array
    arr = [
        random.randint(1, 100) for i in range(10000)
    ]  # generate random numbers array
    return sum(arr) / len(arr)


def fast_average_producer():
    time.sleep(1)  # Do nothing for 1 time units
    # generate random numbers array
    arr = [random.randint(1, 100) for i in range(10000)]
    return sum(arr) / len(arr)


def main_func():
    average = slow_avg_producer()
    print(average)

    result = fast_average_producer()
    print(average)
To get the timing statistics, we first create the LineProfiler object then the main_func() is passed through it to get the wrapper. In the end, we can get the profiling statistics.
from line_profiler import LineProfiler

line_prof = LineProfiler()
line_prof_wrapper = line_prof(main_func)
line_prof_wrapper()
# print the profiling details
line_prof.print_stats()
The above code produces the following output. The time unit is in microseconds.
Timer unit: 1e-06 s

Total time: 7.10521 s
File: <ipython-input-14-67ae2a9633ee>
Function: main_func at line 17

Line #      Hits         Time  Per Hit   % Time  Line Contents
==============================================================
    17                                           def main_func():
    18         1    6054801.0 6054801.0     85.2      average = slow_avg_producer()
    19         1        676.0    676.0      0.0      print(average)
    20
    21         1    1049070.0 1049070.0     14.8      result = fast_average_producer()
    22         1        659.0    659.0      0.0      print(average)
The statistics show that in the main function, the slow_avg_producer() takes 6.054 seconds and the next print statement takes 0.000676 seconds. On the other hand, the fast_average_producer() takes very less time.
Profile Python Code via Command Line
We can use the command line interface to get the line-by-line profiling details of the functions. For this method, we use the kernprof command.
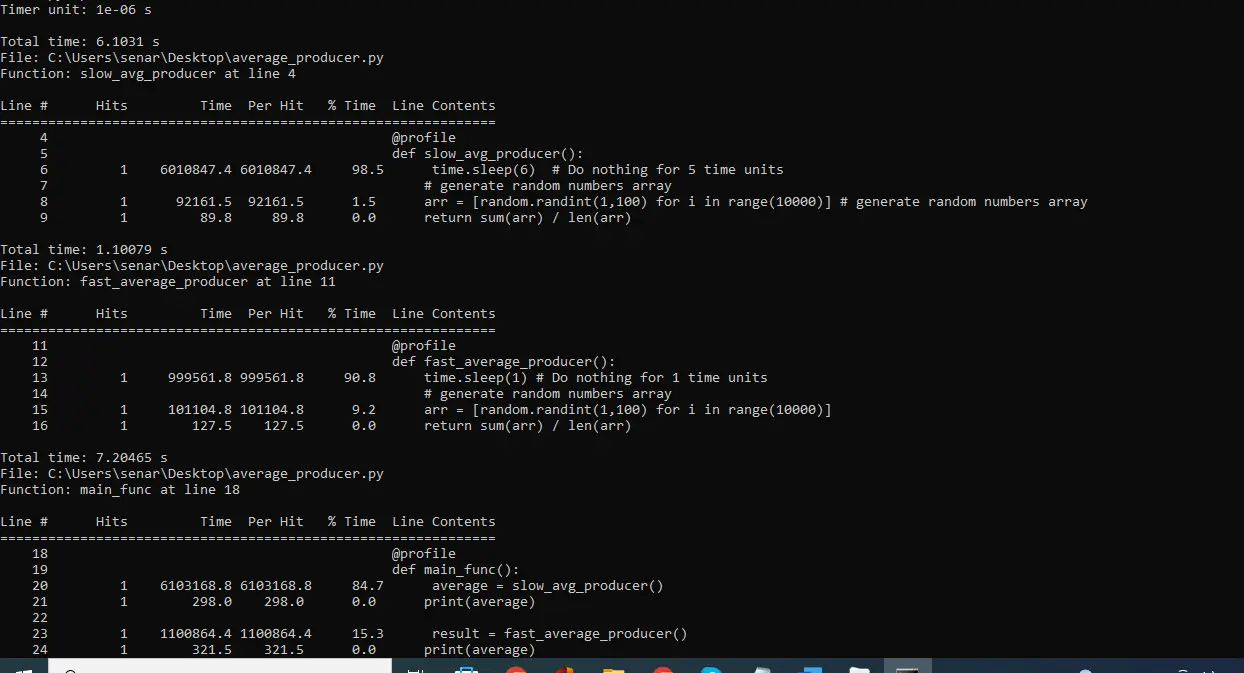
We will use the same functions here, too, except that we will add a decorator, @profile, at the start of each function. We name this script average_producer.py.
import time
import random


@profile
def slow_avg_producer():
    time.sleep(6)  # Do nothing for 5 time units
    # generate random numbers array
    arr = [
        random.randint(1, 100) for i in range(10000)
    ]  # generate random numbers array
    return sum(arr) / len(arr)


@profile
def fast_average_producer():
    time.sleep(1)  # Do nothing for 1 time units
    # generate random numbers array
    arr = [random.randint(1, 100) for i in range(10000)]
    return sum(arr) / len(arr)


@profile
def main_func():
    average = slow_avg_producer()
    print(average)

    result = fast_average_producer()
    print(average)


main_func()
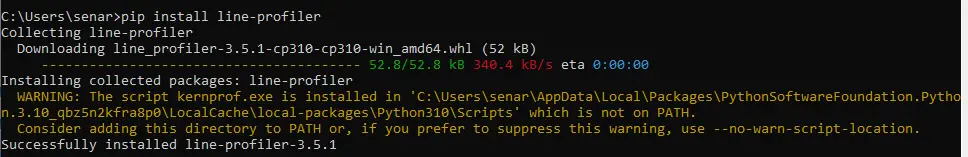
Using the kernprof command, we need to install the line-profiler module using the following command.
pip install line-profiler
For Colab or Jupyter Notebook terminal, use the bang symbol (!) at the start of the above command.
After installation, you must change the directory where kernprof.exe is installed. Then run the following command.
kernprof gives us the option to do cProfile, but we use line profiler here. For that, the -l argument is used.
kernprof -l average_producer.py

Execute the following command to see the profiling results.
python -m line_profiler average_producer.py.lprof
It prints the profiling results on the command line interface, as shown below.