How to Save Pandas Dataframe Table as a PNG
- The Problem with Converting Pandas Dataframe Table Into PNG Image
- Convert Pandas Dataframe Table Into PNG Image With Matplotlib
- Convert Pandas Dataframe Table Into PNG Image With Plotly and Kaleido

The main aim of this article is to demonstrate how a dataframe can be converted into a table and saved as a PNG image in Pandas. We will also learn what problem we face when we convert Pandas dataframe table into a PNG image.
The Problem with Converting Pandas Dataframe Table Into PNG Image
Handling and operating on data is crucial in this technological age, significantly when its scale is increasing at a tremendous age. This calls for different methods and practices to be able to store and operate on the data.
Pandas is a Python module that aims to allow its users to operate and analyze data in many ways. It has become quite popular over time, and the same is valid with Python as it continues to gain popularity at a tremendous rate.
The Dataframe is one of the most widely used tools for handling tabular data, often very helpful in organizing data on a large scale. Sometimes, one may need to store the generated table in a visual state, as in a PNG image.
Consider the following code.
import pandas as pd

df = pd.DataFrame()
df["date"] = ["2016-04-01", "2016-04-02", "2016-04-03", "2016-04-03", "2016-04-03"]
df["calories"] = [2200, 2100, 1500, 2200, 2100]
df["sleep hours"] = [8, 7.5, 8.2, 3, 4]
df["gym"] = [True, False, False, True, True]

print(df)
Output:
         date  calories  sleep hours    gym
0  2016-04-01      2200          8.0   True
1  2016-04-02      2100          7.5  False
2  2016-04-03      1500          8.2  False
3  2016-04-03      2200          3.0   True
4  2016-04-03      2100          4.0   True
The following illustration shows a table that keeps tabs on daily caloric intake, the number of hours spent sleeping, and the total amount of time spent working out.
The example mentioned here is relatively short, but if the data is on a large scale, it may be suitable (by requirements) to convert the table to an image so that it can be viewed independently of the code or for other processing.
Several approaches can be taken to solve this issue, some of which are included in the following list:
Convert Pandas Dataframe Table Into PNG Image With Matplotlib
One of the many features available in the pandas module, it allows tables created to be plotted on screen with the help of Matplotlib.
Consider the following code.
import matplotlib.pyplot as plt
import pandas as pd
from pandas.plotting import table

df = pd.DataFrame()
df["date"] = ["2016-04-01", "2016-04-02", "2016-04-03"]
df["calories"] = [2200, 2100, 1500]
df["sleep hours"] = [8, 7.5, 8.2]
df["gym"] = [True, False, False]

ax = plt.subplot(111, frame_on=False)  # no visible frame
ax.xaxis.set_visible(False)  # hide the x axis
ax.yaxis.set_visible(False)  # hide the y axis
table(ax, df, loc="center")  # where df is your data frame
plt.savefig("mytable.png")
Which gives the output image:
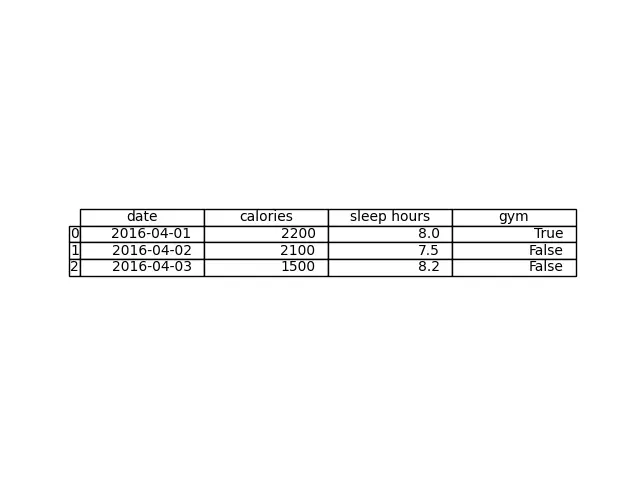
Once we have created the table, we can use matplotlib to generate a plot. Thanks to the pandas support to plot its tables using matplotlib, the overall process is quite simple.
First, we need to import pandas, matplotlib.pyplot and table from matplotlib and pandas.plotting, respectively. These modules are what make this solution able to plot the table.
After we have imported the pandas module, we will then create an instance of the DataFrame class and store it in a variable that is denoted with the name df. According to our requirements, a column labeled date is created, followed by adding five different dates to the column.
The same procedure is carried out to create three additional columns, which are then given the names calories, sleep hours and gym, respectively, and have relevant data inserted into the newly created columns.
After that, we create a subplot using plt.subplot and store it in a variable named ax. This is to ensure that no frames are visible in the final image.
One more optimization that is done is that we have removed the x and y axis lines using ax.xaxis.set_visible() and ax.yaxis.set_visible().
Finally, the table is generated using the table() method, passing it to our subplot, DataFrame, and a central location to create it at the center of the image. After this is done, the image is saved, named mytable.png.
Convert Pandas Dataframe Table Into PNG Image With Plotly and Kaleido
Built on top of the Plotly JavaScript library plotly.js, plotly enables users of Python to create beautiful interactive web-based visualizations.
These visualizations can be displayed in Jupyter notebooks, saved as standalone HTML files, or used as a part of pure Python-built web apps using Dash. plotly was developed by Plotly Inc.
Kaleido is a cross-platform library that generates static pictures (such as png, svg, pdf, and so on), with a particular emphasis on removing the need for any external dependencies.
plotly can be easily installed using:
pip install plotly
As for kaleido:
pip install kaleido
Consider the following code.
import plotly.figure_factory as ff
import pandas as pd

df = pd.DataFrame()
df["date"] = ["2016-04-01", "2016-04-02", "2016-04-03", "2016-04-03", "2016-04-03"]
df["calories"] = [2200, 2100, 1500, 2200, 2100]
df["sleep hours"] = [8, 7.5, 8.2, 3, 4]
df["gym"] = [True, False, False, True, True]

fig = ff.create_table(df)
fig.update_layout(
    autosize=False,
    width=500,
    height=200,
)

fig.write_image("table_plotly.png", scale=2)
Which gives the output image:
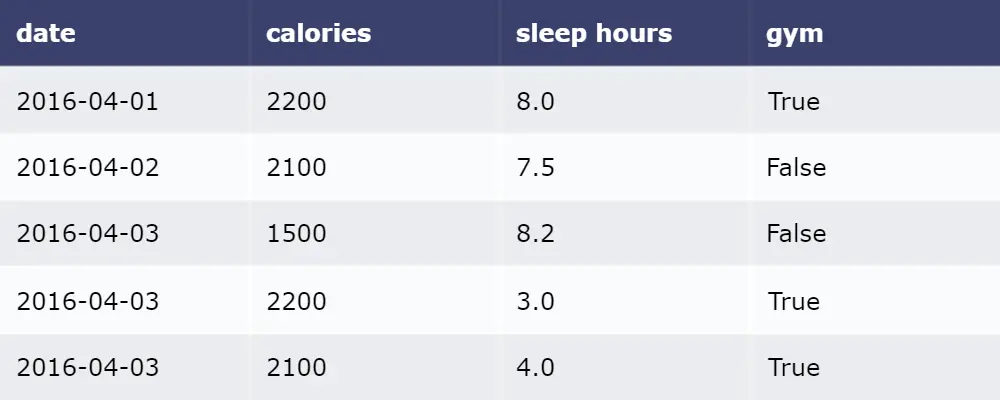
After the Dataframe has been created, we can use the create_table method of plotly.figure_factory to create a table suitable for visualization.
The create_table method is passed to the Dataframe instance that we wish to make a table of, which gets converted to the proper form to be viewed as a PNG.
If it is required to update the overall look and feel of the created PNG of the table, its layout can be updated using various given attributes such as autosize, width, and height using the update_layout method.
After the layout has been set based on preference, the new PNG can now be saved using the write_image method, passing it the name of the image and scale if needed.

Hello! I am Salman Bin Mehmood(Baum), a software developer and I help organizations, address complex problems. My expertise lies within back-end, data science and machine learning. I am a lifelong learner, currently working on metaverse, and enrolled in a course building an AI application with python. I love solving problems and developing bug-free software for people. I write content related to python and hot Technologies.
LinkedIn