How to Plot a Circle in Matplotlib
-
matplotlib.patches.Circle()Method to Plot a Circle in Matplotlib - Circle Equation to Plot a Circle in Matplotlib
- Scatter Plot of Points
To plot a circle in Matplotlib, we can use any of the following methods:
matplotlib.patches.Circle()method- Circle Equation
- Scatter plot of points
matplotlib.patches.Circle() Method to Plot a Circle in Matplotlib
Syntax:
matplotlib.patches.Circle((x, y), r=5, **kwargs)
Where, (x, y) is the center of the circle and r is the radius with a default value of 5.
We need to add a circle to axes with the add_artist method as Circle is a subclass of Artist.
import matplotlib.pyplot as plt

figure, axes = plt.subplots()
draw_circle = plt.Circle((0.5, 0.5), 0.3)

axes.set_aspect(1)
axes.add_artist(draw_circle)
plt.title("Circle")
plt.show()
-method.webp)
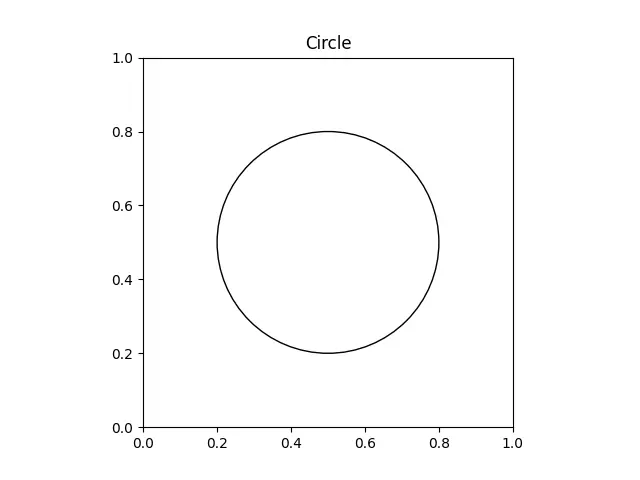
To plot a circle without filling color, we should set the fill parameter to be False.
import matplotlib.pyplot as plt

figure, axes = plt.subplots()
draw_circle = plt.Circle((0.5, 0.5), 0.3, fill=False)

axes.set_aspect(1)
axes.add_artist(draw_circle)
plt.title("Circle")
plt.show()
-method-without-filling-color.webp)
We can make the above code simpler by quickly plugging circle into an existing plot with the help of gcf() and gca() functions.
import matplotlib.pyplot as plt

figure, axes = plt.subplots()
draw_circle = plt.Circle((0.5, 0.5), 0.3, fill=False)

plt.gcf().gca().add_artist(draw_circle)
plt.title("Circle")
axes.set_aspect(1)
plt.show()
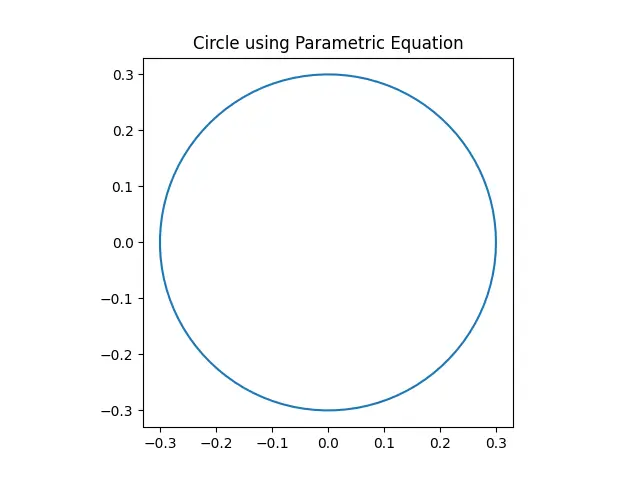
Circle Equation to Plot a Circle in Matplotlib
Parametric Equation of Circle
The parametric equation of circle is x=r*cos(theta) and y=r*sin(theta).
import numpy as np
import matplotlib.pyplot as plt

theta = np.linspace(0, 2 * np.pi, 100)

radius = 0.3

a = radius * np.cos(theta)
b = radius * np.sin(theta)

figure, axes = plt.subplots(1)

axes.plot(a, b)
axes.set_aspect(1)

plt.title("Circle using Parametric Equation")
plt.show()
Center-Radius Form of the Circle Equation
We can also plot circle using the center-radius form of the circle equation.
import numpy as np
import matplotlib.pyplot as plt

x = np.linspace(-0.5, 0.5, 100)
y = np.linspace(-0.5, 0.5, 100)

a, b = np.meshgrid(x, y)

C = a ** 2 + b ** 2 - 0.2

figure, axes = plt.subplots()

axes.contour(a, b, C, [0])
axes.set_aspect(1)

plt.show()

Scatter Plot of Points
We can also draw a circle in Matplotlib using scatter() method and adjust radius using s parameter. The area of the circle is pi/4*s.
import matplotlib.pyplot as plt

plt.scatter(0, 0, s=4000)
plt.title("Circle")

plt.xlim(-0.75, 0.75)
plt.ylim(-0.75, 0.75)

plt.show()


Suraj Joshi is a backend software engineer at Matrice.ai.
LinkedIn