如何在 Matplotlib 中绘制圆
Suraj Joshi
2023年1月30日
Matplotlib
Matplotlib Artist
要在 Matplotlib 中绘制圆,我们可以使用以下任何一种方法:
matplotlib.patches.Circle()方法- 圆方程
- 点的散点图
在 Matplotlib 中使用 matplotlib.patches.Circle() 方法绘制圆
语法:
matplotlib.patches.Circle((x, y), r=5, **kwargs)
其中,(x, y) 是圆心,r 是半径,默认值为 5。
我们需要使用 add_artist 方法在轴上添加 Circle,因为 Circle 是 Artist 的子类。
import matplotlib.pyplot as plt

figure, axes = plt.subplots()
draw_circle = plt.Circle((0.5, 0.5), 0.3)

axes.set_aspect(1)
axes.add_artist(draw_circle)
plt.title("Circle")
plt.show()
-method.webp)
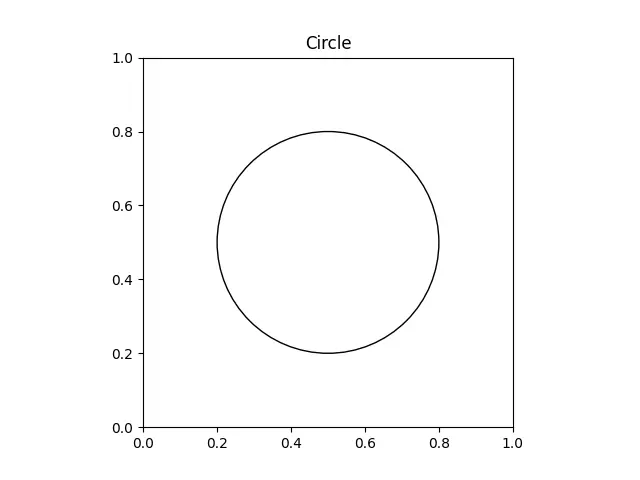
要绘制没有填充颜色的圆,我们应该将 fill 参数设置为 False。
import matplotlib.pyplot as plt

figure, axes = plt.subplots()
draw_circle = plt.Circle((0.5, 0.5), 0.3, fill=False)

axes.set_aspect(1)
axes.add_artist(draw_circle)
plt.title("Circle")
plt.show()
-method-without-filling-color.webp)
通过使用 gcf() 和 gca() 函数将圆快速插入到现有图中,我们可以使上述代码更简单。
import matplotlib.pyplot as plt

figure, axes = plt.subplots()
draw_circle = plt.Circle((0.5, 0.5), 0.3, fill=False)

plt.gcf().gca().add_artist(draw_circle)
plt.title("Circle")
axes.set_aspect(1)
plt.show()
在 Matplotlib 中用圆方程绘制圆
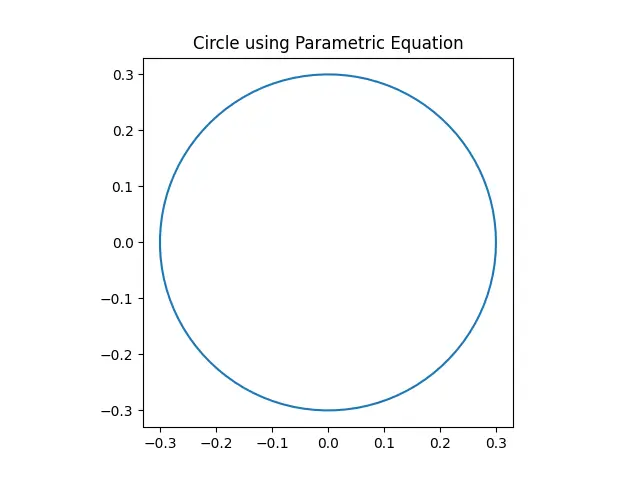
圆的参数方程
圆的参数方程为 x=r*cos(theta) 和 y=r*sin(theta)。
import numpy as np
import matplotlib.pyplot as plt

theta = np.linspace(0, 2 * np.pi, 100)

radius = 0.3

a = radius * np.cos(theta)
b = radius * np.sin(theta)

figure, axes = plt.subplots(1)

axes.plot(a, b)
axes.set_aspect(1)

plt.title("Circle using Parametric Equation")
plt.show()
圆方程的中心半径形式
我们还可以使用圆方程的中心半径形式绘制圆。
import numpy as np
import matplotlib.pyplot as plt

x = np.linspace(-0.5, 0.5, 100)
y = np.linspace(-0.5, 0.5, 100)

a, b = np.meshgrid(x, y)

C = a ** 2 + b ** 2 - 0.2

figure, axes = plt.subplots()

axes.contour(a, b, C, [0])
axes.set_aspect(1)

plt.show()

点的散点图
我们还可以使用 scatter() 方法在 Matplotlib 中绘制一个圆,并使用 s 参数调整半径。圆的面积是 pi/4*s。
import matplotlib.pyplot as plt

plt.scatter(0, 0, s=4000)
plt.title("Circle")

plt.xlim(-0.75, 0.75)
plt.ylim(-0.75, 0.75)

plt.show()

Enjoying our tutorials? Subscribe to DelftStack on YouTube to support us in creating more high-quality video guides. Subscribe
作者: Suraj Joshi

Suraj Joshi is a backend software engineer at Matrice.ai.
LinkedIn