HOWTO · Matplotlib
如何在 Matplotlib 中繪製圓
我們可以在 Matplotlib 中使用 circle patch,圓方程和散點圖繪製圓。
本頁內容
在 Matplotlib 中繪製幾何圓形,可使用 matplotlib.patches.Circle 建立圓形 patch,再加入 Axes。也可以根據圓的方程式繪圖,或用散佈圖標記快速呈現圓形符號。若圓的中心與半徑必須使用資料座標表示,通常直接使用 patch 最方便。
使用 matplotlib.patches.Circle 繪製圓形
matplotlib.patches.Circle 會根據中心 (x, y) 和半徑建立 patch。使用 add_patch 將它加入 Axes;並設定相等的座標軸比例,讓 x 軸與 y 軸上的一個單位在畫面上具有相同長度。
import matplotlib.pyplot as plt
from matplotlib.patches import Circle

fig, ax = plt.subplots()
ax.add_patch(Circle((2, 1), radius=0.75, fill=False, linewidth=2))
ax.set_aspect("equal", adjustable="box")
ax.set_xlim(0, 4)
ax.set_ylim(-1, 3)
ax.set_title("Circle patch")
plt.show()
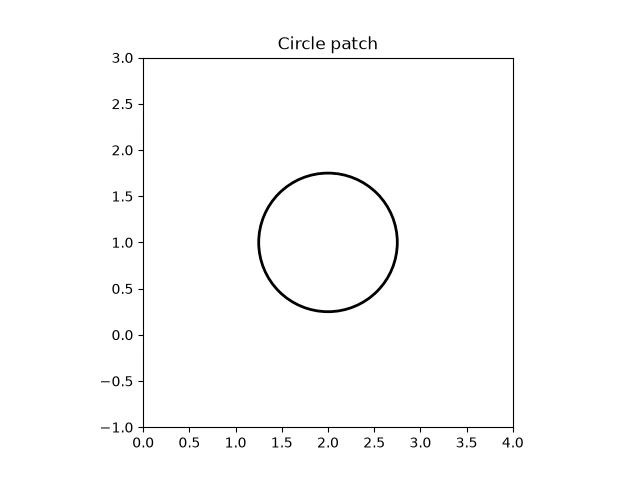
修改第一個引數即可移動中心,修改 radius 即可調整圓的大小。fill=True 是預設值,會填滿圓形;若只要顯示外框,請使用 fill=False。Circle 是一種 Artist,也可以透過 ax.add_artist(circle) 加入圖表。如果圖表已經存在,plt.gcf().gca().add_artist(circle) 會將圓形加入目前圖表的目前 Axes;若圖表包含多個繪圖區,明確指定 Axes 會更清楚。
如果手動設定座標軸範圍,請確保範圍涵蓋整個圓形:中心為 (cx, cy)、半徑為 r 時,x 軸範圍需涵蓋 cx - r 到 cx + r,y 軸範圍則需涵蓋 cy - r 到 cy + r。若範圍在這些界限內停止,patch 或依方程式繪製的曲線就會有部分被裁切。若希望靠近邊框的外圓線也清楚可見,請預留足夠空間。
根據圓的方程式繪製圓形
參數方程式可描述圓周上的各個點。若圓心為 (cx, cy)、半徑為 r,可使用 x = cx + r cos(theta) 和 y = cy + r sin(theta)。將角度從零取樣到 2π,即可描繪完整的圓周。
import numpy as np
import matplotlib.pyplot as plt

center_x, center_y = 2, 1
radius = 0.75
theta = np.linspace(0, 2 * np.pi, 200)
x = center_x + radius * np.cos(theta)
y = center_y + radius * np.sin(theta)

fig, ax = plt.subplots()
ax.plot(x, y)
ax.set_aspect("equal", adjustable="box")
ax.set_title("Circle from a parametric equation")
plt.show()
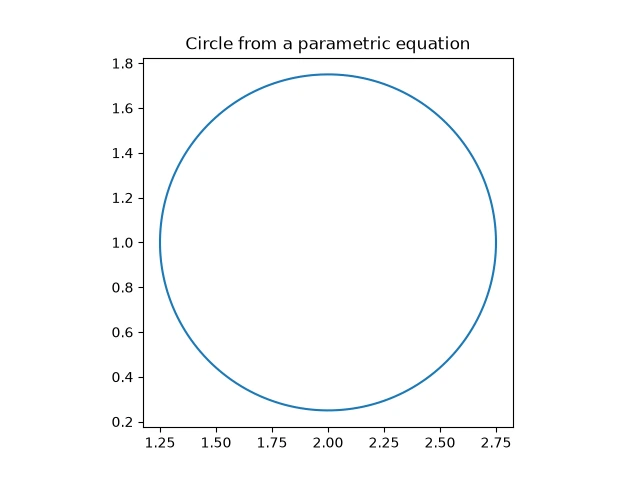
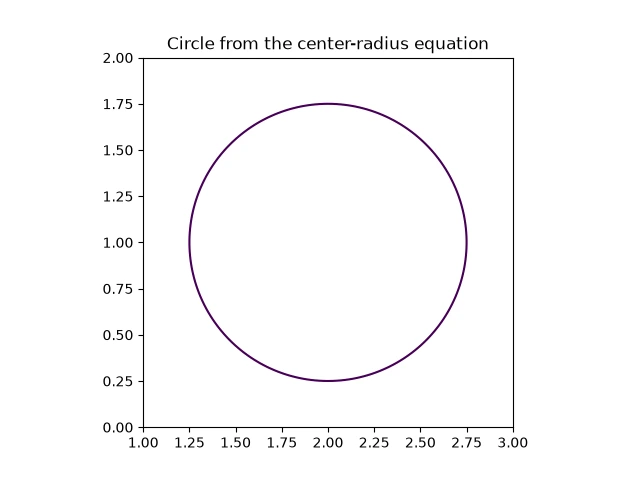
也可以將圓心半徑式 (x - cx)² + (y - cy)² = r² 畫成高度為零的等高線。從等式左側減去 r**2,在網格上計算結果,再繪出零等高線。網格範圍需包含整個圓,並維持座標軸比例相等,否則畫面上的圓可能會看起來像橢圓。
import numpy as np
import matplotlib.pyplot as plt

center_x, center_y = 2, 1
radius = 0.75
x = np.linspace(center_x - radius - 0.25, center_x + radius + 0.25, 100)
y = np.linspace(center_y - radius - 0.25, center_y + radius + 0.25, 100)
X, Y = np.meshgrid(x, y)
values = (X - center_x) ** 2 + (Y - center_y) ** 2 - radius ** 2

fig, ax = plt.subplots()
ax.contour(X, Y, values, levels=[0])
ax.set_aspect("equal", adjustable="box")
ax.set_title("Circle from the center-radius equation")
plt.show()
使用散佈圖標記繪製圓形
scatter 會在每個指定的資料點上繪製標記。它的 s 引數設定標記面積,單位為 points squared(點的平方);因此適合用來呈現大小隨顯示畫面固定的圓形符號,而非半徑以資料座標計量的幾何圓形。
import matplotlib.pyplot as plt

fig, ax = plt.subplots()
ax.scatter([2], [1], s=500, marker="o")
ax.set_xlim(0, 4)
ax.set_ylim(-1, 3)
ax.set_aspect("equal", adjustable="box")
ax.set_title("Circular scatter marker")
plt.show()
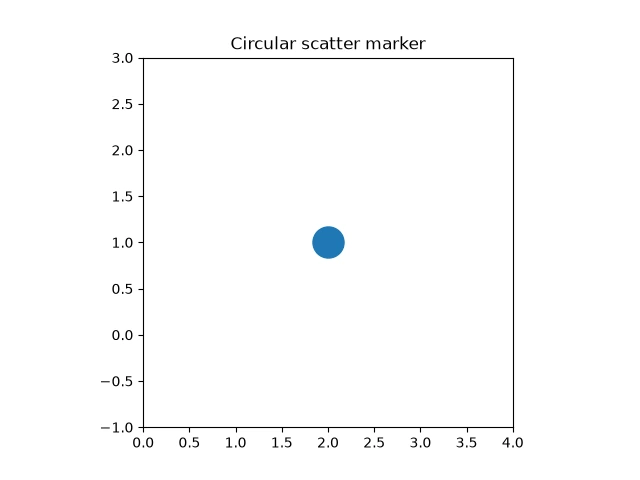
增加或減少 s 即可調整標記在畫面上的面積。若半徑必須對應圖表座標軸上的距離,請使用 Circle patch;若要在資料點上放置視覺大小一致的標記,則可使用散佈圖標記。
這種依顯示尺寸呈現的特性,適合用來強調測量點、標示圓心,或在讀者可能縮放的圖表上放置符號。座標軸比例改變時,標記仍以排版點數為基準,因此其視覺大小不代表繪圖資料中的固定距離。若圓形本身代表讀者需要與其他資料值比較的半徑,請改用 patch 或方程式曲線。
為什麼圓看起來像橢圓
前面的所有範例都使用 set_aspect("equal", adjustable="box") 設定相等的座標軸比例。若省略這一列,Matplotlib 會使用自動比例:Axes 會填滿其邊框,而邊框的寬大於高,因此 x 軸上的一個單位在畫面上會比 y 軸上的一個單位更長。patch 在資料座標中仍然是圓,但在畫面上看起來像橢圓。下面的範例與第一個範例使用相同的中心與半徑,只省略了設定比例的那一列。
import matplotlib.pyplot as plt
from matplotlib.patches import Circle

fig, ax = plt.subplots()
ax.add_patch(Circle((2, 1), radius=0.75, fill=False, linewidth=2))
ax.set_xlim(0, 4)
ax.set_ylim(-1, 3)
ax.set_title("Circle patch without an equal aspect ratio")
plt.show()
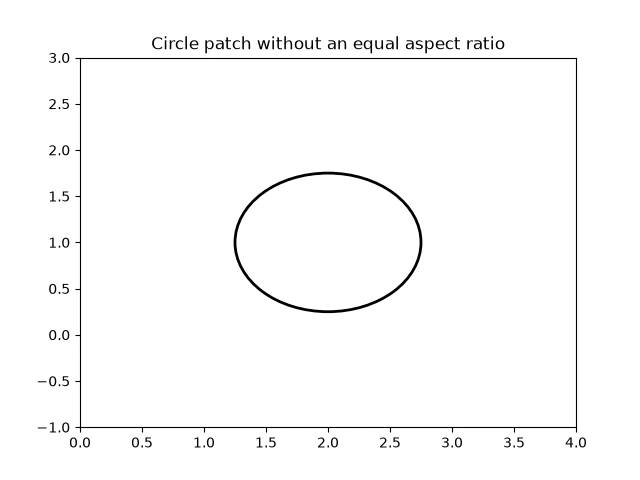
修正方法是像前面的範例一樣,在設定座標軸範圍之前加入 ax.set_aspect("equal", adjustable="box")。方程式曲線與等高線也會出現相同問題:比例不相等時,任何一種畫法看起來都會被拉伸。指定 adjustable="box" 後,為了讓兩個座標軸使用相同的縮放比例,Axes 可能會縮小;這是預期行為,並不是資料出錯。