How to Change Matplotlib Plot Size
-
Set the
figsizeinfigure()Methods to Set Matplotlib Plot Size -
Set
rcParamsto Change Matplotlib Plot Size -
set_figheight()Along Withset_figwidth()to Set Matplotlib Plot Size -
set_size_inches()Method to Change the Matplotlib Figure Size - Change Figure Format in Matplotlib

We could use the set_figheight() along with set_figwidth() and set_size_inches() methods to change Matplotlib plot size. We can also change Matplotlib plot size by setting figsize in the figure() method and rcParams. Similarly, to change figure format we simply change extension of image file in the savefig() method.
Set the figsize in figure() Methods to Set Matplotlib Plot Size
We can set the value of figsize parameter in figure() method during initialization, which specifies the width and height of the figure in inches.
import numpy as np
import matplotlib.pyplot as plt

x = np.linspace(0, 10, 0.5)
m = 1
c = 2
y = m * x + c

plt.figure(figsize=(6, 4))
plt.plot(x, y)
plt.title("y=mx+c")
plt.xlabel("x-axis")
plt.ylabel("y-axis")

plt.show()
Output:
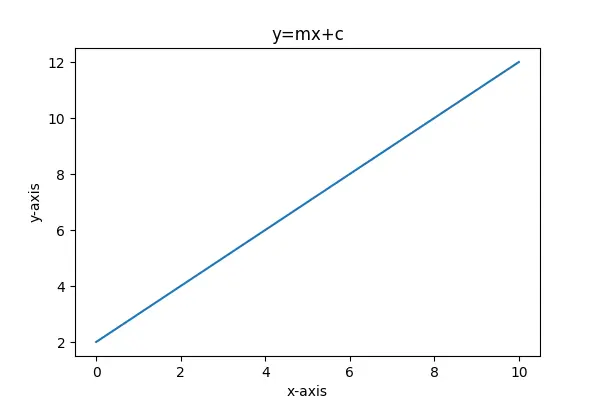
The default value of the figsize parameter is [6.4, 4.8].
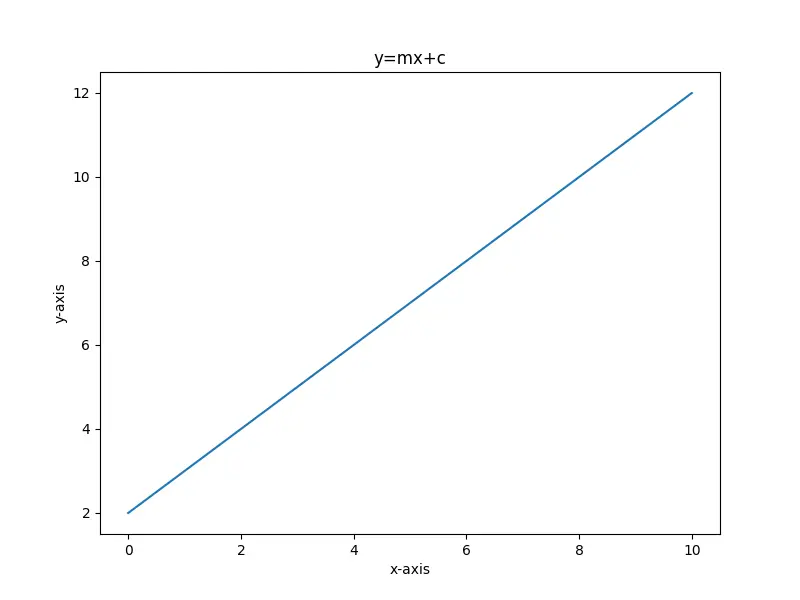
Set rcParams to Change Matplotlib Plot Size
We can change the default figure.figsize value stored in the matplotlib.rcParams dictionary to change the figure size in Matplotlib.
import numpy as np
import matplotlib.pyplot as plt

x = np.linspace(0, 10, 20)
m = 1
c = 2
y = m * x + c

plt.rcParams["figure.figsize"] = (8, 6)
plt.plot(x, y)
plt.title("y=mx+c")
plt.xlabel("x-axis")
plt.ylabel("y-axis")

plt.show()
Output:
set_figheight() Along With set_figwidth() to Set Matplotlib Plot Size
If the figure is already created, we can change the plot size using set_figheight() and set_figwidth() methods.
import numpy as np
import matplotlib.pyplot as plt

x = np.linspace(0, 10, 20)
m = 1
c = 2
y = m * x + c

fig = plt.figure()
plt.plot(x, y)
plt.title("y=mx+c")
plt.xlabel("x-axis")
plt.ylabel("y-axis")
fig.set_figheight(6)
fig.set_figwidth(8)

plt.show()
Output:
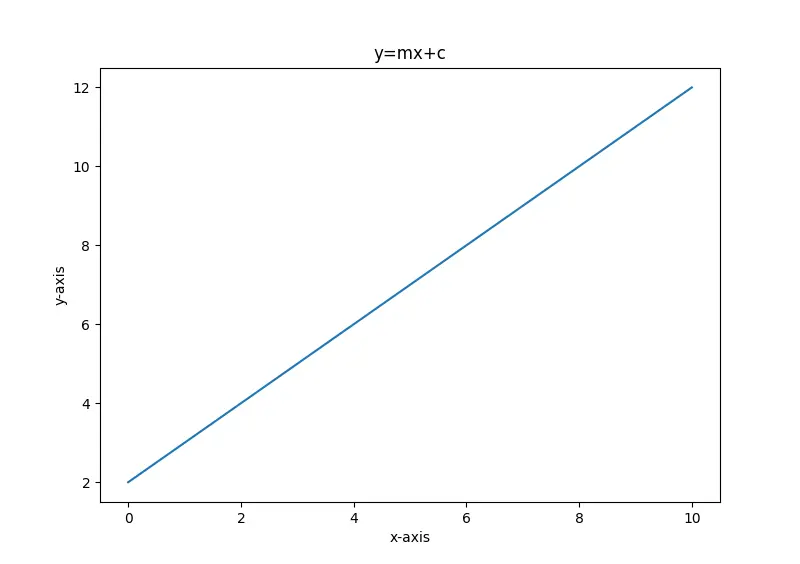
Here, the set_figheight() method sets the height of the figure and set_figwidth() sets the width of the figure.
set_size_inches() Method to Change the Matplotlib Figure Size
This method could also set the Matplotlib plot size after the figure has been created.
import numpy as np
import matplotlib.pyplot as plt

x = np.linspace(0, 10, 20)
m = 1
c = 2
y = m * x + c

fig = plt.figure()
plt.plot(x, y)
plt.title("y=mx+c")
plt.xlabel("x-axis")
plt.ylabel("y-axis")
fig.set_size_inches(5, 5)

plt.show()
Output:

Here, the arguments passed into set_size_inches() method represent the figure’s width and height in inches, respectively.
Change Figure Format in Matplotlib
To change the figure format, we can change the image file’s extension in the savefig() method. We can save plots in different formats like png, jpg, svg, pdf, and many more.
import numpy as np
import matplotlib.pyplot as plt

x = np.linspace(0, 10, 20)
m = 1
c = 2
y = m * x + c

fig = plt.figure()
plt.plot(x, y)
plt.title("y=mx+c")
plt.xlabel("x-axis")
plt.ylabel("y-axis")
fig.set_size_inches(5, 5)

plt.savefig("Figure saved in jpg format.jpg")
This saves the figure in the jpg format.

Suraj Joshi is a backend software engineer at Matrice.ai.
LinkedIn