How to Manually Set the Size of the Bins in Matplotlib Histogram
To draw the histogram, we use hist2d() function where the number of bins n is passed as a parameter. We can set the size of bins by calculating the required number of bins in order to maintain the required size.
Bin Boundaries as a Parameter to hist() Function
Syntax for hist function:
hist(x,
     bins: NoneType=None,
     range: NoneType=None,
     density: NoneType=None,
     weights: NoneType=None,
     cumulative: bool=False,
     bottom: NoneType=None,
     histtype: str=built-ins.str,
     align: str=built-ins.str,
     orientation: str=built-ins.str,
     rwidth: NoneType=None,
     log: bool=False,
     color: NoneType=None,
     label: NoneType=None,
     stacked: bool=False,
     normed: NoneType=None,
     data: NoneType=None,
     **kwargs)
To set the size of the bins in Matplotlib, we pass a list with the bin boundaries instead of the number of bins as the bin parameter.
import numpy as np
import numpy.random as random
import matplotlib.pyplot as plt

data = np.random.random_sample(100) * 100.0
plt.hist(data, bins=[0, 10, 20, 30, 40, 50, 60, 80, 100])
plt.xlabel("Value")
plt.ylabel("Counts")
plt.title("Histogram Plot of Data")
plt.grid(True)
plt.show()
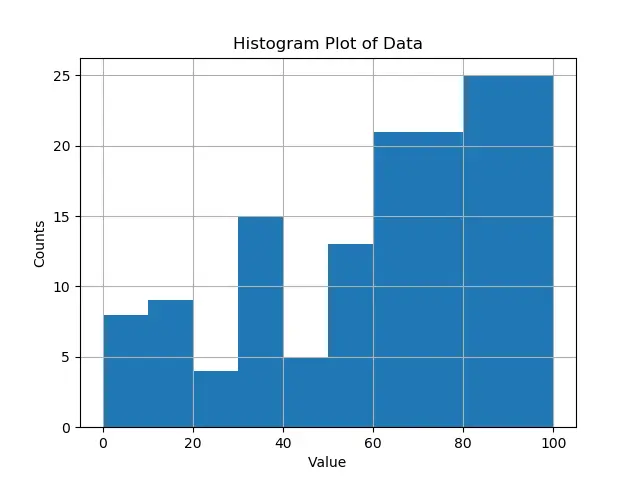
We manually set the bin boundaries, and indirectly bin width, in the above example. We could also use np.arange to find equally spaced boundaries.
To make the bins equally spaced, we can use np.arange to find equally spaced boundaries
import numpy as np
import numpy.random as random
import matplotlib.pyplot as plt

binwidth = 10
data = np.random.random_sample(100) * 100.0
plt.hist(data, bins=np.arange(min(data), max(data) + binwidth, binwidth))
plt.xlabel("Data")
plt.ylabel("Counts")
plt.title("Histogram Plot of Data")
plt.grid(True)
plt.show()
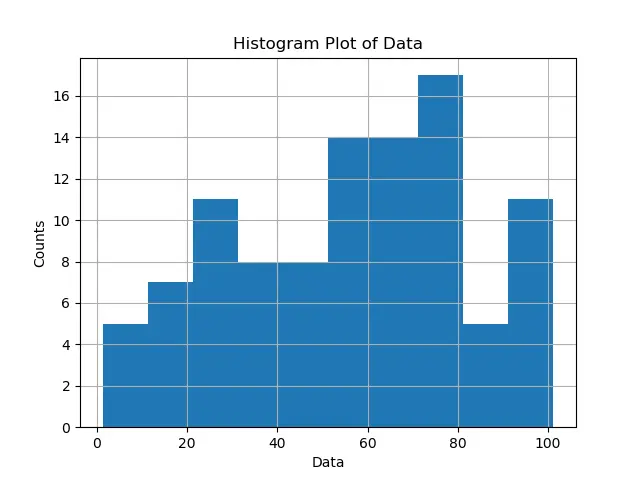
np.arange shall be max(data) + binwidth but not max(data), because the interval created by np.arange(start, stop, step) includes start but excludes stop. Therefore, we need to add the interval binwidth to max(data) to make the actual stop as max(data).Compute the Number of Bins From Desired Width
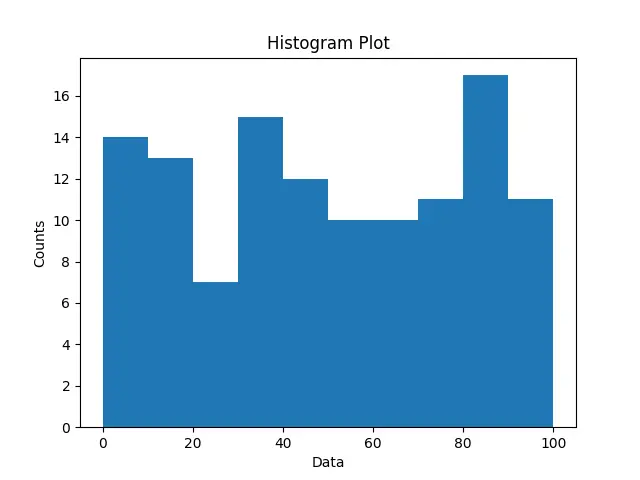
To find the number of bins, we calculate the result of maximum value-minimum value divided by the desired bin width.
import numpy as np
import matplotlib.pyplot as plt


def find_bins(observations, width):
    minimmum = np.min(observations)
    maximmum = np.max(observations)
    bound_min = -1.0 * (minimmum % width - minimmum)
    bound_max = maximmum - maximmum % width + width
    n = int((bound_max - bound_min) / width) + 1
    bins = np.linspace(bound_min, bound_max, n)
    return bins


data = np.random.random_sample(120) * 100
bins = find_bins(data, 10.0)
plt.hist(data, bins=bins)
plt.xlabel("Data")
plt.ylabel("Counts")
plt.title("Histogram Plot")
plt.show()

Suraj Joshi is a backend software engineer at Matrice.ai.
LinkedIn