如何在 Matplotlib 直方圖中手動設定 bin 的大小
Suraj Joshi
2023年1月30日
Matplotlib
Matplotlib Histogram
要繪製直方圖,我們使用 hist2d() 函式,其中將 bin (箱數)n 作為引數傳遞。我們可以通過計算所需的箱數來設定箱的大小,以保持所需的大小。
將 bin 邊界作為 hist() 函式的引數
hist 函式的語法:
hist(x,
     bins: NoneType=None,
     range: NoneType=None,
     density: NoneType=None,
     weights: NoneType=None,
     cumulative: bool=False,
     bottom: NoneType=None,
     histtype: str=builtins.str,
     align: str=builtins.str,
     orientation: str=builtins.str,
     rwidth: NoneType=None,
     log: bool=False,
     color: NoneType=None,
     label: NoneType=None,
     stacked: bool=False,
     normed: NoneType=None,
     data: NoneType=None,
     **kwargs)
為了在 Matplotlib 中設定 bin 的大小,我們傳遞一個帶有 bin 邊界而不是 bin 數量的列表作為 bin 引數。
import numpy as np
import numpy.random as random
import matplotlib.pyplot as plt

data = np.random.random_sample(100) * 100.0
plt.hist(data, bins=[0, 10, 20, 30, 40, 50, 60, 80, 100])
plt.xlabel("Value")
plt.ylabel("Counts")
plt.title("Histogram Plot of Data")
plt.grid(True)
plt.show()
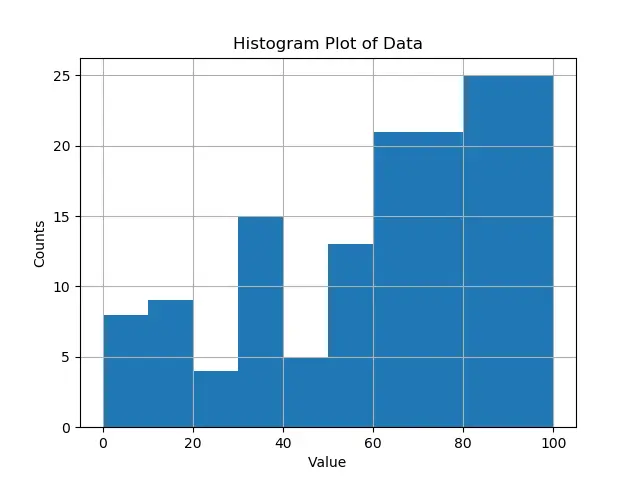
在上面的示例中,我們手動設定 bin 邊界,並間接設定 bin 的寬度。我們也可以使用 np.arange 找到等距的邊界。
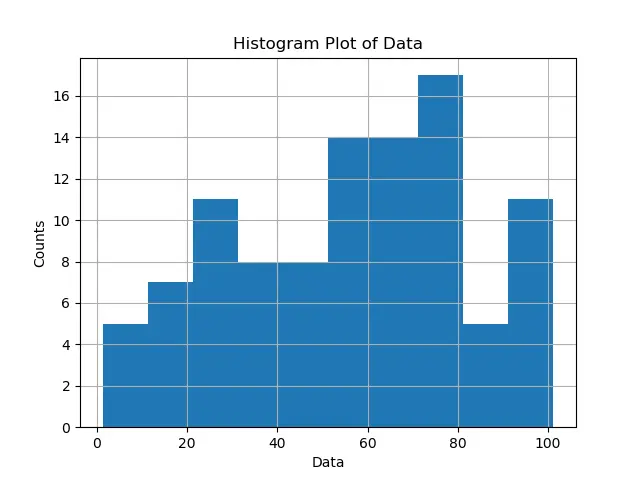
為了使 bin 等距分佈,我們可以使用 np.arange 查詢等距邊界。
import numpy as np
import numpy.random as random
import matplotlib.pyplot as plt

binwidth = 10
data = np.random.random_sample(100) * 100.0
plt.hist(data, bins=np.arange(min(data), max(data) + binwidth, binwidth))
plt.xlabel("Data")
plt.ylabel("Counts")
plt.title("Histogram Plot of Data")
plt.grid(True)
plt.show()
警告
np.arange 的第二個引數應該是 max(data) + binwidth,而不是 max(data),因為 np.arange(start, top, step) 建立的間隔包括 start,但是不包含 end。因此,我們需要在 max(data) 上新增區間 binwidth,以使實際停止為 max(data)。從所需寬度計算 bin 的數量(箱數)
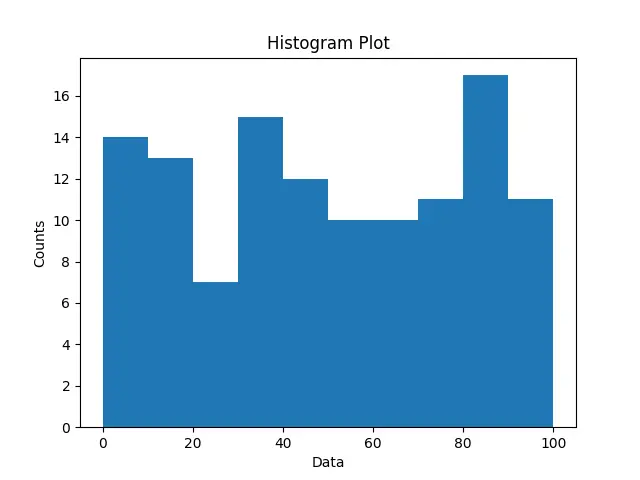
為了找到 bin 的數量,我們計算最大值和最小值之間的差除以所需的 bin(箱)寬度。
import numpy as np
import matplotlib.pyplot as plt


def find_bins(observations, width):
    minimmum = np.min(observations)
    maximmum = np.max(observations)
    bound_min = -1.0 * (minimmum % width - minimmum)
    bound_max = maximmum - maximmum % width + width
    n = int((bound_max - bound_min) / width) + 1
    bins = np.linspace(bound_min, bound_max, n)
    return bins


data = np.random.random_sample(120) * 100
bins = find_bins(data, 10.0)
plt.hist(data, bins=bins)
plt.xlabel("Data")
plt.ylabel("Counts")
plt.title("Histogram Plot")
plt.show()
Enjoying our tutorials? Subscribe to DelftStack on YouTube to support us in creating more high-quality video guides. Subscribe
作者: Suraj Joshi

Suraj Joshi is a backend software engineer at Matrice.ai.
LinkedIn