Matplotlib 히스토그램에서 빈의 크기를 수동으로 설정하는 방법
Suraj Joshi
2023년1월30일
Matplotlib
Matplotlib Histogram
히스토그램을 그리려면 bin 개수 n이 매개 변수로 전달되는 hist2d() 함수를 사용합니다. 필요한 크기를 유지하기 위해 필요한 빈 수를 계산하여 빈 크기를 설정할 수 있습니다.
hist()함수에 대한 매개 변수로서 bin 경계
hist 함수에 대한 구문:
hist(x,
     bins: NoneType=None,
     range: NoneType=None,
     density: NoneType=None,
     weights: NoneType=None,
     cumulative: bool=False,
     bottom: NoneType=None,
     histtype: str=builtins.str,
     align: str=builtins.str,
     orientation: str=builtins.str,
     rwidth: NoneType=None,
     log: bool=False,
     color: NoneType=None,
     label: NoneType=None,
     stacked: bool=False,
     normed: NoneType=None,
     data: NoneType=None,
     **kwargs)
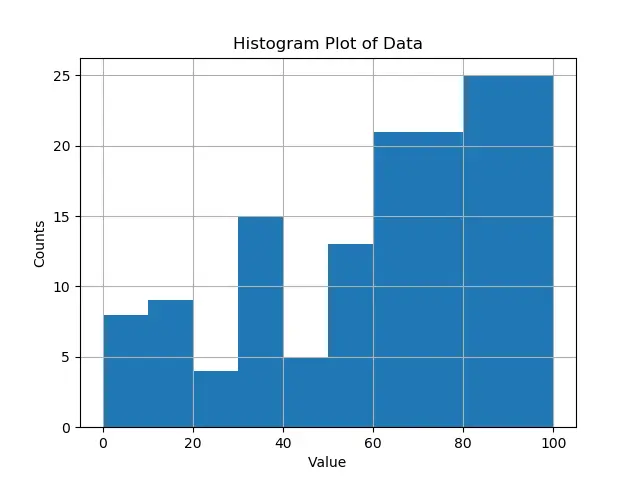
Matplotlib에서 bin의 크기를 설정하기 위해 bin 수 대신 bin 경계를 가진 목록을bin 매개 변수로 전달합니다.
import numpy as np
import numpy.random as random
import matplotlib.pyplot as plt

data = np.random.random_sample(100) * 100.0
plt.hist(data, bins=[0, 10, 20, 30, 40, 50, 60, 80, 100])
plt.xlabel("Value")
plt.ylabel("Counts")
plt.title("Histogram Plot of Data")
plt.grid(True)
plt.show()
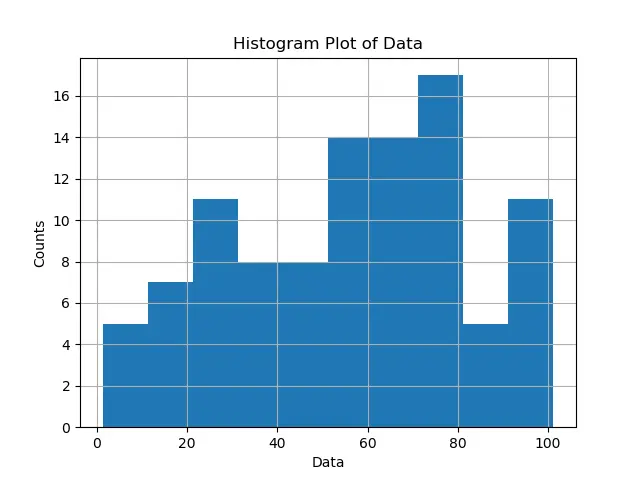
위의 예제에서 빈 경계와 간접 빈 너비를 수동으로 설정했습니다. np.arange를 사용하여 같은 간격의 경계를 찾을 수도 있습니다.
빈을 같은 간격으로 만들기 위해, np.arange를 사용하여 같은 간격의 경계를 찾을 수 있습니다
import numpy as np
import numpy.random as random
import matplotlib.pyplot as plt

binwidth = 10
data = np.random.random_sample(100) * 100.0
plt.hist(data, bins=np.arange(min(data), max(data) + binwidth, binwidth))
plt.xlabel("Data")
plt.ylabel("Counts")
plt.title("Histogram Plot of Data")
plt.grid(True)
plt.show()
경고
np.arange(start, stop, step)에 의해 생성 된 간격은start를 포함하기 때문에 np.arange의 두 번째 매개 변수는 max(data) + binwidth이지만 max(data)는 아닙니다. stop을 제외합니다. 따라서 실제 정지를max(data)로하려면binwidth 간격을max(data)에 추가해야합니다.원하는 너비에서 구간 수 계산
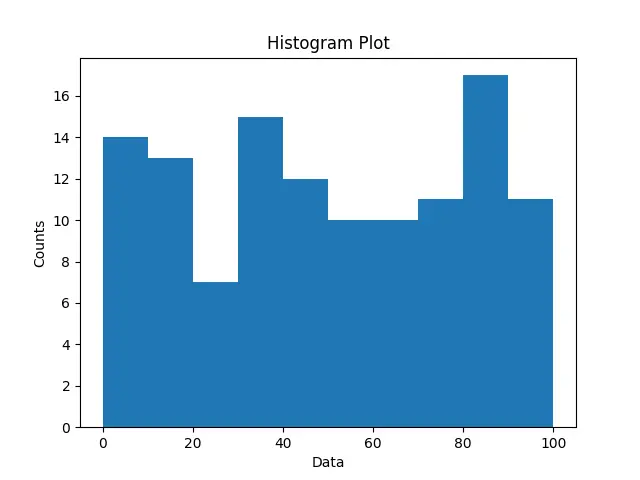
구간 수를 찾기 위해 ‘최대 값-최소값’을 원하는 구간 너비로 나눈 결과를 계산합니다.
import numpy as np
import matplotlib.pyplot as plt


def find_bins(observations, width):
    minimmum = np.min(observations)
    maximmum = np.max(observations)
    bound_min = -1.0 * (minimmum % width - minimmum)
    bound_max = maximmum - maximmum % width + width
    n = int((bound_max - bound_min) / width) + 1
    bins = np.linspace(bound_min, bound_max, n)
    return bins


data = np.random.random_sample(120) * 100
bins = find_bins(data, 10.0)
plt.hist(data, bins=bins)
plt.xlabel("Data")
plt.ylabel("Counts")
plt.title("Histogram Plot")
plt.show()
튜토리얼이 마음에 드시나요? DelftStack을 구독하세요 YouTube에서 저희가 더 많은 고품질 비디오 가이드를 제작할 수 있도록 지원해주세요. 구독하다
작가: Suraj Joshi

Suraj Joshi is a backend software engineer at Matrice.ai.
LinkedIn