Matplotlib 에서 두 개의 히스토그램을 함께 플롯하는 방법
동시에 하나의 그림에 두 개의 히스토그램을 그릴 수 있습니다. 아래는 겹치는 막대가 있거나없는 두 개의 히스토그램을 만드는 방법을 보여줍니다.
겹치는 막대가없는 두 개의 히스토그램
작업 예제 코드:
import numpy as np
import matplotlib.pyplot as plt

a = np.random.normal(0, 3, 3000)
b = np.random.normal(2, 4, 2000)

bins = np.linspace(-10, 10, 20)

plt.hist([a, b], bins, label=["a", "b"])
plt.legend(loc="upper left")
plt.show()

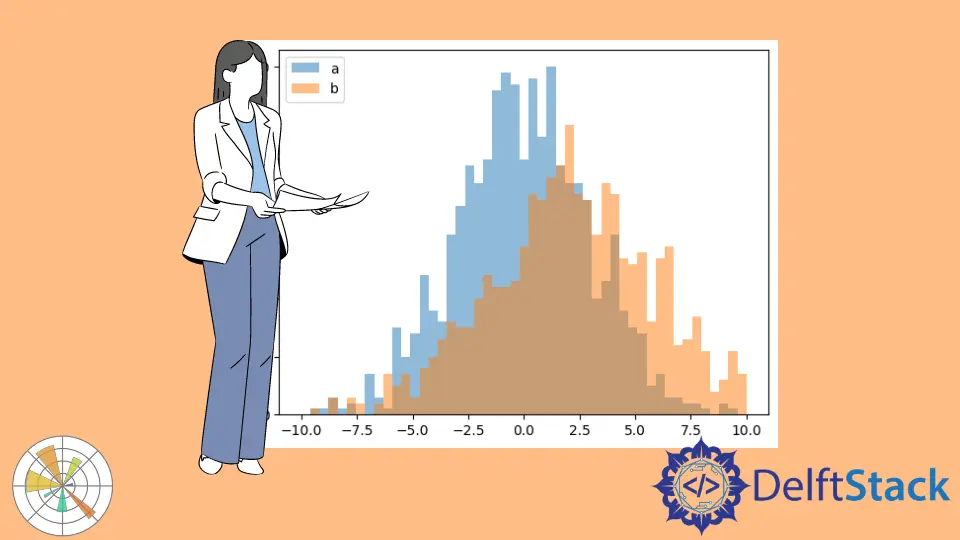
겹치는 막대가있는 두 개의 히스토그램
작업 예제 코드:
import numpy as np
import matplotlib.pyplot as plt

a = np.random.normal(0, 3, 1000)
b = np.random.normal(2, 4, 900)

bins = np.linspace(-10, 10, 50)

plt.hist(a, bins, alpha=0.5, label="a")
plt.hist(b, bins, alpha=0.5, label="b")
plt.legend(loc="upper left")

plt.show()

히스토그램을 개별적으로 플로팅하기 위해 plt.hist를 두 번 호출하면 두 히스토그램에 위에서 볼 수 있듯이 막대가 겹치게됩니다.
alpha 속성은 플롯의 투명도를 지정합니다. 0.0 은 투명하고 1.0 은 불투명합니다.
두 히스토그램 모두에서 ‘알파’가 0.5로 설정되면 겹친 영역에 결합 된 색상이 표시됩니다. 그러나 ‘알파’가 기본값 인 0.0인 경우 중첩 막대는 두 히스토그램 중 더 높은 값의 색상 만 표시하고 다른 색상은 아래와 같이 숨겨집니다.


Founder of DelftStack.com. Jinku has worked in the robotics and automotive industries for over 8 years. He sharpened his coding skills when he needed to do the automatic testing, data collection from remote servers and report creation from the endurance test. He is from an electrical/electronics engineering background but has expanded his interest to embedded electronics, embedded programming and front-/back-end programming.
LinkedIn Facebook