Matplotlib で 2つのヒストグラムを同時にプロットする方法
胡金庫
2023年1月30日
Matplotlib
Matplotlib Histogram
2つのヒストグラムを 1つの図に同時にプロットできます。以下は、重なり合うバーがある場合とない場合の 2つのヒストグラムを作成する方法を示しています。
バーが重複しない 2つのヒストグラム
作業例コード:
import numpy as np
import matplotlib.pyplot as plt

a = np.random.normal(0, 3, 3000)
b = np.random.normal(2, 4, 2000)

bins = np.linspace(-10, 10, 20)

plt.hist([a, b], bins, label=["a", "b"])
plt.legend(loc="upper left")
plt.show()

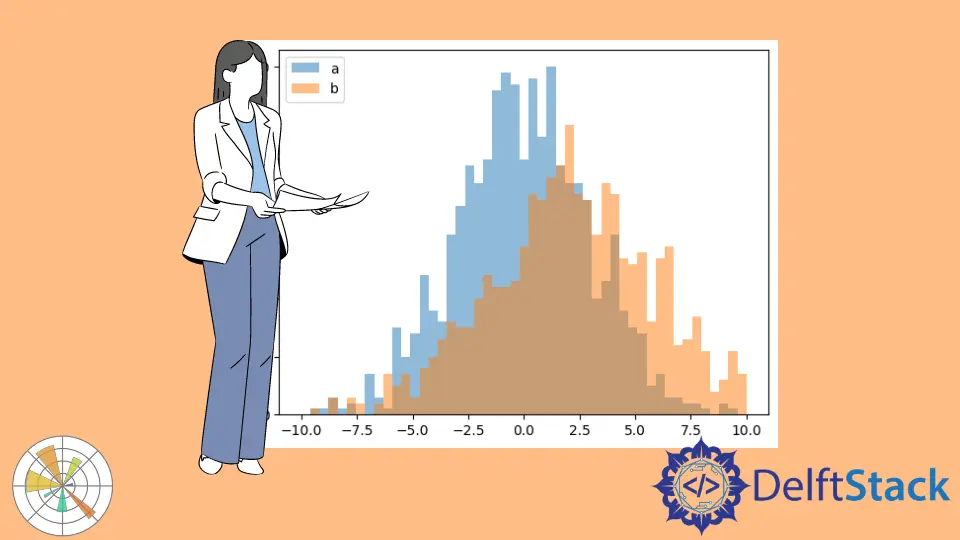
バーが重なっている 2つのヒストグラム
作業例コード:
import numpy as np
import matplotlib.pyplot as plt

a = np.random.normal(0, 3, 1000)
b = np.random.normal(2, 4, 900)

bins = np.linspace(-10, 10, 50)

plt.hist(a, bins, alpha=0.5, label="a")
plt.hist(b, bins, alpha=0.5, label="b")
plt.legend(loc="upper left")

plt.show()

plt.hist を 2 回呼び出してヒストグラムを個別にプロットすると、2つのヒストグラムは上記のようにバーが重なっています。
alpha プロパティはプロットの透明度を指定します。0.0 は透明で、1.0 は不透明です。
両方のヒストグラムで alpha が 0.5 に設定されている場合、オーバーラップした領域は結合された色を示します。ただし、alpha がデフォルト値の 0.0 の場合、重なり合ったバーは、以下に示すように、2つのヒストグラムのうち高い方の値の色のみを表示し、他の色は非表示になります。

チュートリアルを楽しんでいますか? <a href="https://www.youtube.com/@delftstack/?sub_confirmation=1" style="color: #a94442; font-weight: bold; text-decoration: underline;">DelftStackをチャンネル登録</a> して、高品質な動画ガイドをさらに制作するためのサポートをお願いします。 Subscribe
著者: 胡金庫
