The linspace() Function in MATLAB
-
What is the
linspace()Function? - Basic Usage of linspace()
- Generating Vectors with linspace()
- Using linspace() for Plotting
- Advanced Usage of linspace()
- Conclusion
- FAQ

MATLAB is a powerful tool for numerical computing, and one of its most useful functions is linspace(). This function allows users to generate linearly spaced vectors, which are essential for various applications in data analysis, simulations, and mathematical modeling. Whether you’re a beginner just getting started or a seasoned MATLAB user looking to optimize your code, understanding how to effectively use linspace() can significantly enhance your programming efficiency.
In this article, we will explore the linspace() function in detail, including its syntax, usage, and practical examples. By the end, you’ll have a solid grasp of how to leverage this function to create vectors that suit your specific needs.
What is the linspace() Function?
The linspace() function in MATLAB creates a vector of evenly spaced values over a specified interval. The basic syntax is:
linspace(startValue, endValue, numberOfPoints)
startValue: The beginning value of the vector.endValue: The ending value of the vector.numberOfPoints: The total number of points to generate between the start and end values.
If you don’t specify the number of points, MATLAB defaults to generating 100 points. This flexibility makes linspace() an excellent choice for creating vectors for plotting functions, simulations, or any scenario requiring evenly spaced data points.
Basic Usage of linspace()
Let’s start with a simple example that illustrates how to use the linspace() function to create a vector.
vector1 = linspace(0, 10, 5)
Output:
0 2.5 5.0 7.5 10.0
In this example, we generated a vector that starts at 0 and ends at 10, with a total of 5 points. The output shows that linspace() has divided the interval into four equal segments, resulting in the values 0, 2.5, 5.0, 7.5, and 10.0.
The beauty of linspace() lies in its ability to simplify the creation of vectors without the need for manual calculations. You can easily adjust the start and end values and the number of points to suit your specific requirements.
Generating Vectors with linspace()
Now, let’s explore how to generate vectors with different start and end values using linspace().
vector2 = linspace(-5, 5, 11)
Output:
-5.0000 -4.0000 -3.0000 -2.0000 -1.0000 0 1.0000 2.0000 3.0000 4.0000 5.0000
In this example, we created a vector starting at -5 and ending at 5, generating a total of 11 points. This effectively divides the range into equal intervals, providing a clear representation of values from -5 to 5.
Using linspace() for generating vectors is particularly useful in scenarios such as plotting graphs, where you need a specific range of values. Not only does it save time, but it also reduces the chances of errors that can occur when calculating intervals manually.
Using linspace() for Plotting
One of the most common applications of the linspace() function is in plotting functions. By generating a set of x-values, you can easily create corresponding y-values for your graph.
x = linspace(0, 2*pi, 100);
y = sin(x);
plot(x, y)
Output:
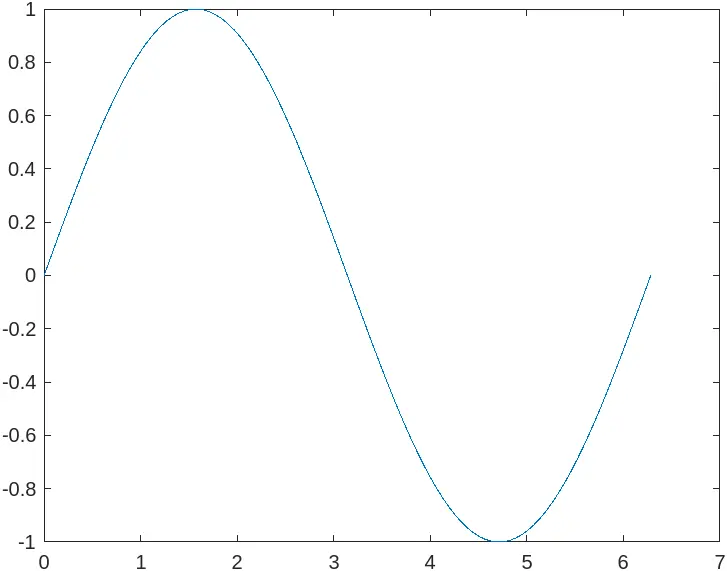
In this example, we created 100 points between 0 and 2π (approximately 6.2832). The sin() function is then applied to these x-values to generate the corresponding y-values. Finally, we used the plot() function to visualize the sine wave.
This method is incredibly efficient for creating smooth curves in plots. By adjusting the number of points, you can control the resolution of your graph, allowing for more detailed representations of functions.
Advanced Usage of linspace()
The linspace() function also supports generating vectors with complex numbers. This can be particularly useful in fields such as engineering and physics, where complex values often arise.
vector3 = linspace(1+1i, 2+2i, 5)
Output:
1.0000 + 1.0000i 1.2500 + 1.2500i 1.5000 + 1.5000i 1.7500 + 1.7500i 2.0000 + 2.0000i
In this example, we generated a vector of complex numbers that starts at 1 + 1i and ends at 2 + 2i, with a total of 5 points. The output shows the evenly spaced complex values, which are essential in various applications, including signal processing and control systems.
By incorporating complex numbers into your vectors, you can expand the functionality of your MATLAB programs, making linspace() a versatile tool in your coding toolkit.
Conclusion
The linspace() function in MATLAB is a powerful utility for generating linearly spaced vectors. Whether you’re creating simple ranges for calculations, preparing data for plotting, or working with complex numbers, linspace() simplifies the process and enhances your coding efficiency. By understanding its syntax and applications, you can leverage this function to improve your MATLAB projects. So the next time you need a vector of evenly spaced values, remember the power of linspace()—it might just save you time and effort!
FAQ
-
What does the
linspace()function do in MATLAB?
Thelinspace()function generates a vector of linearly spaced values between a specified start and end point. -
Can I create complex numbers using linspace()?
Yes, linspace() can generate vectors that include complex numbers. -
What happens if I don’t specify the number of points in linspace()?
If you don’t specify the number of points, linspace() will default to generating 100 points. -
How can I visualize data using linspace()?
You can use linspace() to create x-values for plotting functions, then calculate y-values based on those x-values. -
Is linspace() more efficient than using a for loop to create vectors?
Yes, using linspace() is generally more efficient and less error-prone than manually calculating values in a for loop.
