Pandas DataFrame DataFrame.plot.scatter() Function
-
Syntax of
pandas.DataFrame.plot.scatter(): -
Example Codes: Generate Scatter Plot With
DataFrame.plot.scatter() -
Example Codes: Set Color of Points in Scatter Plot Generated Using
DataFrame.plot.scatter() -
Example Codes: Set Size of Points in Scatter Plot Generated Using
DataFrame.plot.scatter()
pandas.DataFrame.plot.scatter() creates a scatter plot from the given DataFrame columns.
Syntax of pandas.DataFrame.plot.scatter():
DataFrame.plot.scatter(x, y, s=None, c=None, **kwargs)
Parameters
x |
Integer or String. Column name or position to be placed along the X-axis |
y |
Integer or String. Column name or position to be placed along Y-axis |
s |
Scalar or array_like. Size of each point on scatter plot |
c |
String, Integer or array_like. Color of each point on scatter plot |
**kwargs |
keyword arguments for DataFrame.plot() |
Example Codes: Generate Scatter Plot With DataFrame.plot.scatter()
import pandas as pd
import matplotlib.pyplot as plt
df = pd.DataFrame({'X':
[1,2,3,4,5],
'Y': [1, 2, 3,4,5],
'Z': [3,4,5,6,1]})
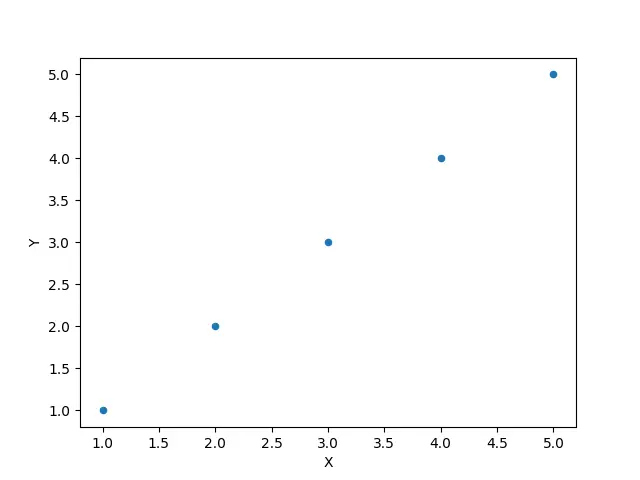
scatter_plot=df.plot.scatter(x='X',y='Y')
scatter_plot.plot()
plt.show()
Output:
This method generates a scatter plot with column X placed along the X-axis, and column Y placed along Y-axis. We use matplotlib.pyplot to show the generated plot.
Example Codes: Set Color of Points in Scatter Plot Generated Using DataFrame.plot.scatter()
import pandas as pd
import matplotlib.pyplot as plt

df = pd.DataFrame({'X':
                   [1,2,3,4,5],
                   'Y': [1, 2, 3,4,5],
                   'Z': [3,4,5,6,3]})
scatter_plot=df.plot.scatter(x='X',y='Z',c="Red")
scatter_plot.plot()
plt.show()
Output:
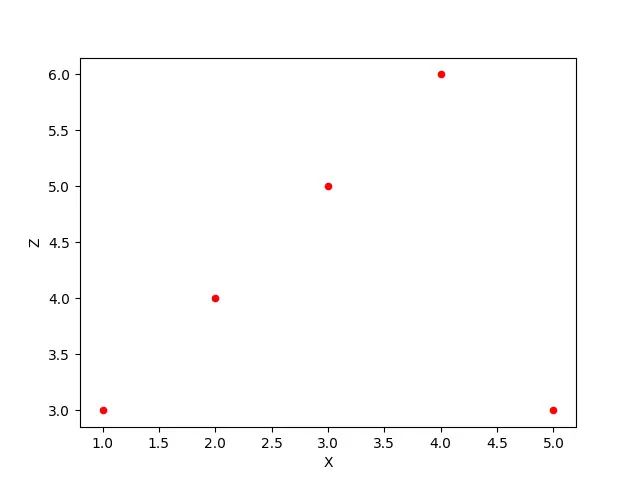
This method generates a scatter plot with column X placed along the X-axis, and column Z placed along Y-axis. The color of points in scatter plot is set to red passing c="Red" as an argument in DataFrame.plot.scatter() function.
You can also set other colors of points in the scatter plot using the c parameter.
Example Codes: Set Size of Points in Scatter Plot Generated Using DataFrame.plot.scatter()
import pandas as pd
import matplotlib.pyplot as plt

df = pd.DataFrame({'X':
                   [1,2,3,4,5],
                   'Y': [1, 2, 3,4,5],
                   'Z': [3,4,5,6,3]})
scatter_plot=df.plot.scatter(x='X',y='Z',s=50,c="Green")
scatter_plot.plot()
plt.show()
Output:
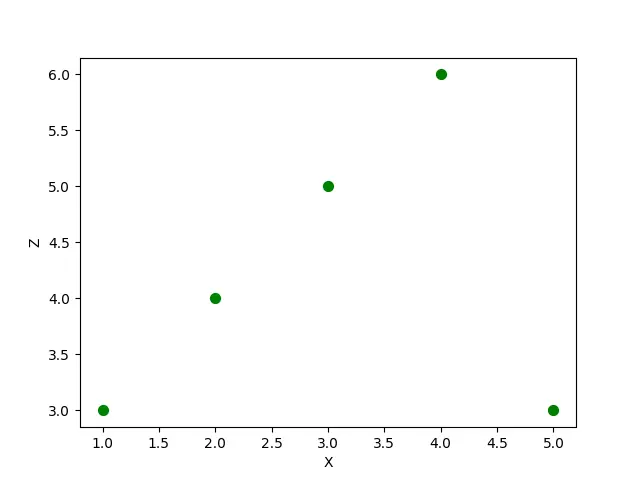
This method generates a scatterplot with column X placed along the X-axis, and column Z placed along Y-axis. The color of points in the scatter plot is set to Green and size of the points to 50 passing c="Green" and s=50 as arguments in DataFrame.plot.scatter() function.

Suraj Joshi is a backend software engineer at Matrice.ai.
LinkedIn