How to Draw Line on Image in Matlab
-
Draw Line on an Image Using the
plot()Function in MATLAB -
Draw Line on an Image Using the
insertshape()Function in MATLAB

This tutorial will discuss how to draw lines and other shapes on an image using the plot() and insertshape() function in MATLAB.
Draw Line on an Image Using the plot() Function in MATLAB
If you want to draw a line or other variables like the sine wave on an image, you can use the plot() function to do that. For example, let’s draw a line on an image. See the code below.
load clown
image(X)
hold on
plot([180 50], [60 250],'Color','r','LineWidth',5)
Output:
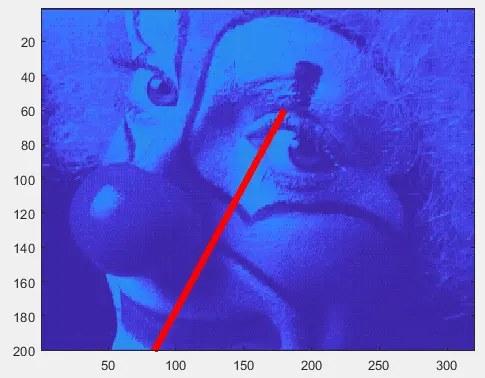
In the above code, we have used an already stored clown image and plotted a line on the clown image using the hold on command. You can change the color of the line using the Color property and the line width using the LineWidth property. You can also change the starting and ending point of the line.
Draw Line on an Image Using the insertshape() Function in MATLAB
If you want to draw shapes: line, circle, rectangle, and polygon on an image, you can use the insertshape() function to do that. The basic syntax of the insertshape() function is given below.
Output = insertShape(Image, shape, shape_position)
In the above code, Image is the image object on which you want to draw, shape is the shape you want to draw on the image, shape_position is the position on the image at which you want to draw the shape. For example, let’s draw a circle on an image. See the code below.
X = imread('peppers.png');
output = insertShape(X,'circle',[100 100 100],'LineWidth',5);
imshow(output)
Output:
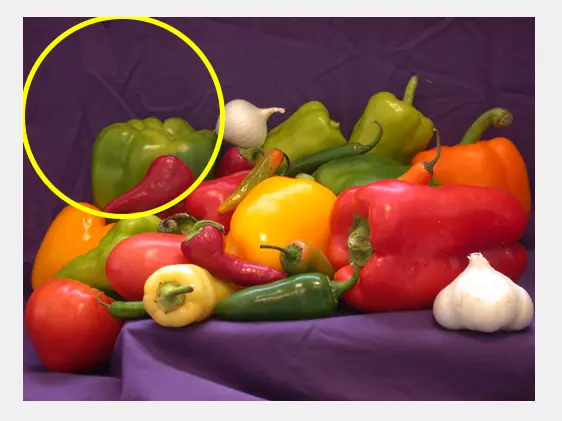
In the above code, we have used an already stored peppers image, and a circle is drawn on the image using the insertshape() function. In the case of a circle, the position consists of three values; the first value is the x-axis position, the second value is the y-axis position, and the third value is the radius of the circle. In the case of a rectangle, the position consists of four values, the first value is the x-axis position, the second value is the y-axis position, the third value is the width, and the fourth value is the height of the rectangle. You can also change the color of the shape using the Color property, the line width using the LineWidth property, and also the opacity in case of filled shapes using the Opacity property. Check this link for more details about the insertshape() function.
