HOWTO · Matplotlib
Matplotlib で円をプロットする方法
Matplotlib でパッチ円、円方程式、および散布図を使用して円をプロットできます。
このページの内容
Matplotlib で円をプロットするには、次のいずれかの方法を使用できます。
matplotlib.patches.Circle()メソッド- サークル方程式
- ポイントの散布図
Matplotlib で円を描画するための matplotlib.patches.Circle() メソッド
構文:
matplotlib.patches.Circle((x, y), r=5, **kwargs)
ここで、(x, y) は円の中心で、r はデフォルト値の 5 の半径です。
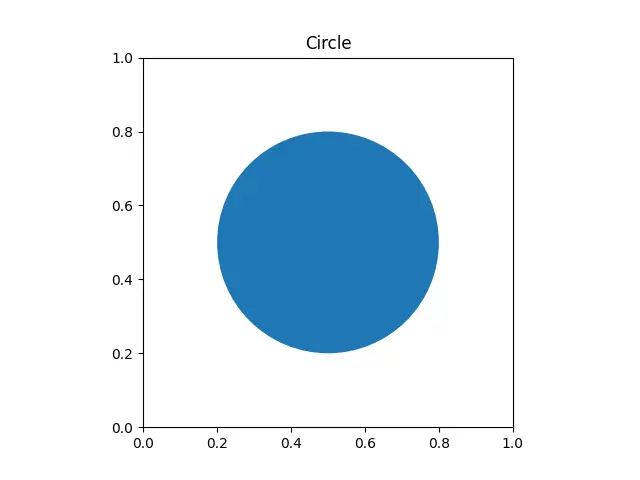
Circle は Artist のサブクラスなので、add_artist メソッドで軸に Circle を追加する必要があります。
import matplotlib.pyplot as plt

figure, axes = plt.subplots()
draw_circle = plt.Circle((0.5, 0.5), 0.3)

axes.set_aspect(1)
axes.add_artist(draw_circle)
plt.title("Circle")
plt.show()
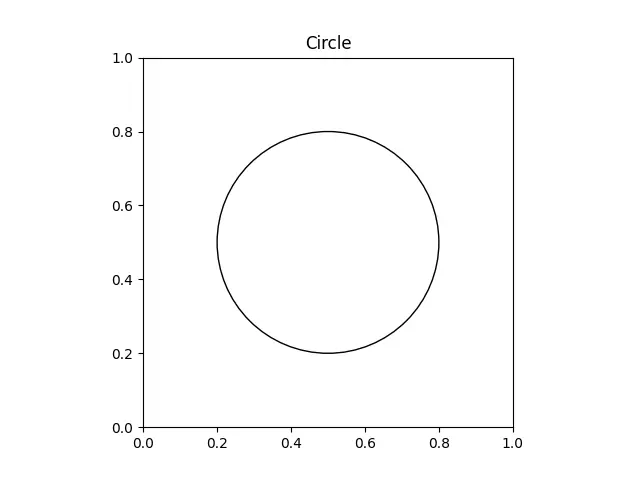
塗りつぶしなしで円をプロットするには、fill パラメータを False に設定する必要があります。
import matplotlib.pyplot as plt

figure, axes = plt.subplots()
draw_circle = plt.Circle((0.5, 0.5), 0.3, fill=False)

axes.set_aspect(1)
axes.add_artist(draw_circle)
plt.title("Circle")
plt.show()
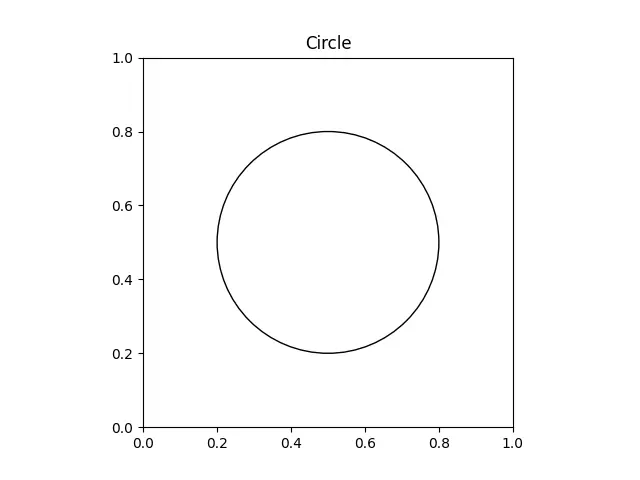
gcf() および gca() 関数を使用して円を既存のプロットにすばやくプラグインすることで、上記のコードをより簡単にすることができます。
import matplotlib.pyplot as plt

figure, axes = plt.subplots()
draw_circle = plt.Circle((0.5, 0.5), 0.3, fill=False)

plt.gcf().gca().add_artist(draw_circle)
plt.title("Circle")
axes.set_aspect(1)
plt.show()
Matplotlib で円をプロットする円方程式
円のパラメトリック方程式
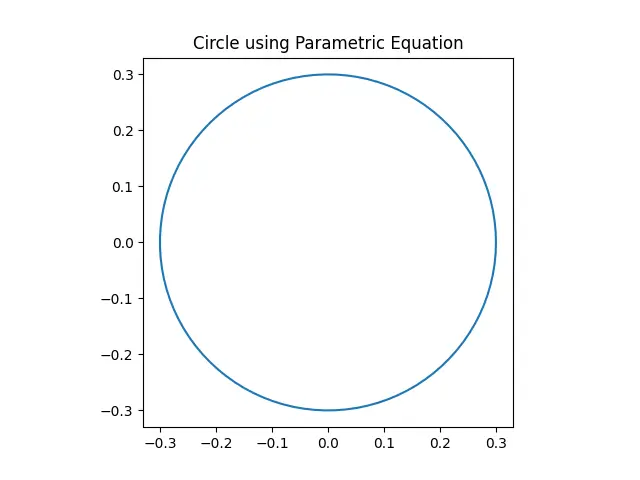
円のパラメトリック方程式は、x=r*cos(theta) と y=r*sin(theta) です。
import numpy as np
import matplotlib.pyplot as plt

theta = np.linspace(0, 2 * np.pi, 100)

radius = 0.3

a = radius * np.cos(theta)
b = radius * np.sin(theta)

figure, axes = plt.subplots(1)

axes.plot(a, b)
axes.set_aspect(1)

plt.title("Circle using Parametric Equation")
plt.show()
円方程式の中心半径形式
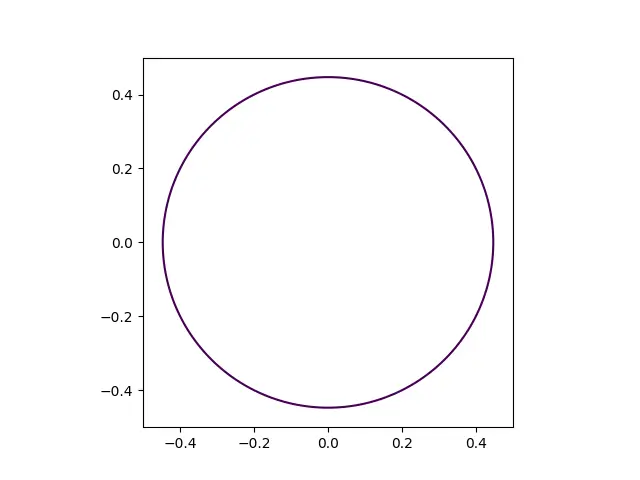
円の方程式の中心半径形式を使用して円をプロットすることもできます。
import numpy as np
import matplotlib.pyplot as plt

x = np.linspace(-0.5, 0.5, 100)
y = np.linspace(-0.5, 0.5, 100)

a, b = np.meshgrid(x, y)

C = a ** 2 + b ** 2 - 0.2

figure, axes = plt.subplots()

axes.contour(a, b, C, [0])
axes.set_aspect(1)

plt.show()
ポイントの散布図
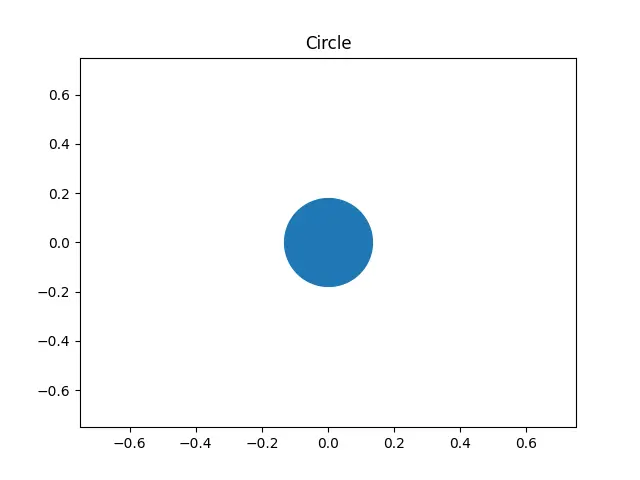
また、scatter() メソッドを使用して Matplotlib に円を描画し、s パラメータを使用して半径を調整することもできます。円の面積は pi/4*s です。
import matplotlib.pyplot as plt

plt.scatter(0, 0, s=4000)
plt.title("Circle")

plt.xlim(-0.75, 0.75)
plt.ylim(-0.75, 0.75)

plt.show()