Matplotlib で図のタイトルと軸ラベルのフォントサイズを設定する方法
Suraj Joshi
2023年1月30日
Matplotlib
Matplotlib Font
-
fontsizeパラメータを調整して、Matplotlib のタイトルと軸のフォントサイズを設定する -
rcParams辞書のデフォルト値を変更する -
Matplotlib でタイトルと軸のフォントサイズを設定する
set_size()メソッド
Matplotlib のタイトルと軸のサイズとフォントは、fontsize パラメータを調整し、set_size() メソッドを使用して、rcParams 辞書の値を変更することで設定できます。
fontsize パラメータを調整して、Matplotlib のタイトルと軸のフォントサイズを設定する
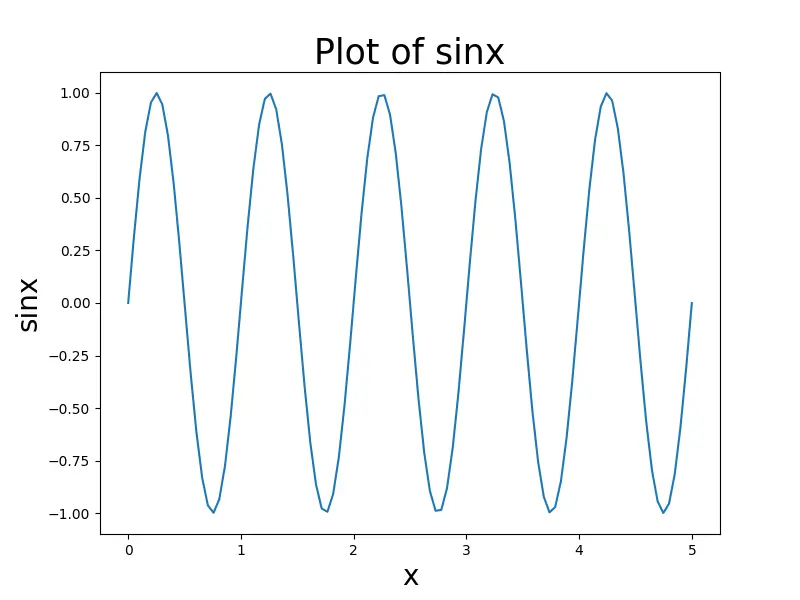
label および title メソッドの fontsize パラメータの適切な値を調整して、Matplotlib でラベルのフォントサイズとプロットのタイトルを設定できます。
import numpy as np
import matplotlib.pyplot as plt

x = np.linspace(0, 5, 100)
y = np.sin(2 * np.pi * x)

fig = plt.figure(figsize=(8, 6))
plt.plot(
    x,
    y,
)
plt.title("Plot of sinx", fontsize=25)
plt.xlabel("x", fontsize=20)
plt.ylabel("sinx", fontsize=20)

plt.show()
rcParams 辞書のデフォルト値を変更する
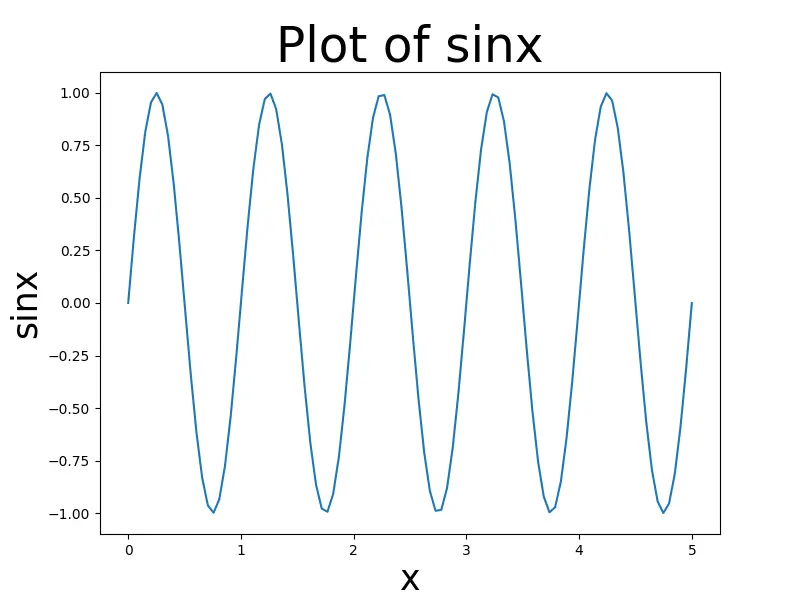
matplotlib.rcParams と呼ばれるグローバル辞書のような変数に保存されているデフォルトの rc 設定を変更して、Matplotlib のラベルのフォントサイズとプロットのタイトルを設定できます。
rcParams の構造:
rcParams キーの完全なリストは、plt.rcParams.keys() 関数を介して取得できます
| キー | 説明 |
|---|---|
axes.labelsize |
x および y ラベルのフォントサイズ |
axes.titlesize |
軸タイトルのフォントサイズ |
figure.titlesize |
図のタイトルのサイズ(Figure.suptitle()) |
xtick.labelsize |
目盛りラベルのフォントサイズ |
ytick.labelsize |
目盛りラベルのフォントサイズ |
legend.fontsize |
凡例のフォントサイズ(plt.legend()、fig.legend()) |
legend.title_fontsize |
凡例タイトルのフォントサイズ、なしはデフォルトの軸と同じに設定されます。 |
import numpy as np
import matplotlib.pyplot as plt

x = np.linspace(0, 5, 100)
y = np.sin(2 * np.pi * x)

parameters = {"axes.labelsize": 25, "axes.titlesize": 35}
plt.rcParams.update(parameters)

fig = plt.figure(figsize=(8, 6))
plt.plot(x, y)
plt.title("Plot of sinx")
plt.xlabel("x")
plt.ylabel("sinx")

plt.show()
Matplotlib でタイトルと軸のフォントサイズを設定する set_size() メソッド
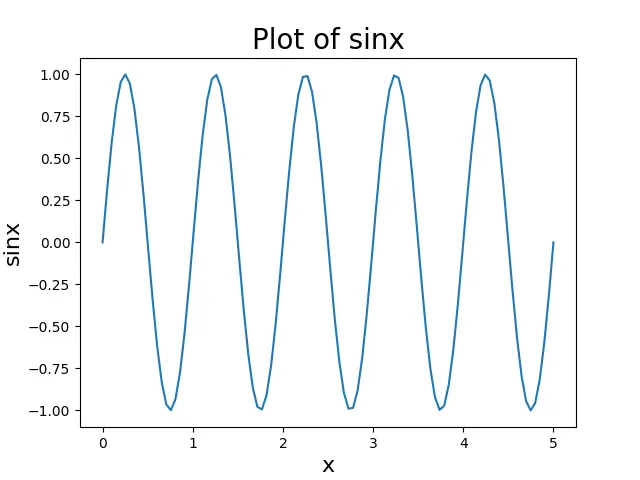
最初に、gca() メソッドを使用してプロットの軸を返します。次に、axes.title.set_size(title_size)、axes.xaxis.label.set_size(x_size) および axes.yaxis.label.set_size(y_size) を使用して、title のフォントサイズを変更します。それぞれ x 軸ラベルと y 軸ラベル。
import numpy as np
import matplotlib.pyplot as plt

x = np.linspace(0, 5, 100)
y = np.sin(2 * np.pi * x)

axes = plt.gca()
plt.plot(x, y)
axes.set_title("Plot of sinx")
axes.set_xlabel("x")
axes.set_ylabel("sinx")

axes.title.set_size(20)
axes.xaxis.label.set_size(16)
axes.yaxis.label.set_size(16)

plt.show()
チュートリアルを楽しんでいますか? <a href="https://www.youtube.com/@delftstack/?sub_confirmation=1" style="color: #a94442; font-weight: bold; text-decoration: underline;">DelftStackをチャンネル登録</a> して、高品質な動画ガイドをさらに制作するためのサポートをお願いします。 Subscribe
著者: Suraj Joshi

Suraj Joshi is a backend software engineer at Matrice.ai.
LinkedIn